Paiute vs Osage Single Female Poverty
COMPARE
Paiute
Osage
Single Female Poverty
Single Female Poverty Comparison
Paiute
Osage
25.5%
SINGLE FEMALE POVERTY
0.0/ 100
METRIC RATING
312th/ 347
METRIC RANK
24.4%
SINGLE FEMALE POVERTY
0.0/ 100
METRIC RATING
291st/ 347
METRIC RANK
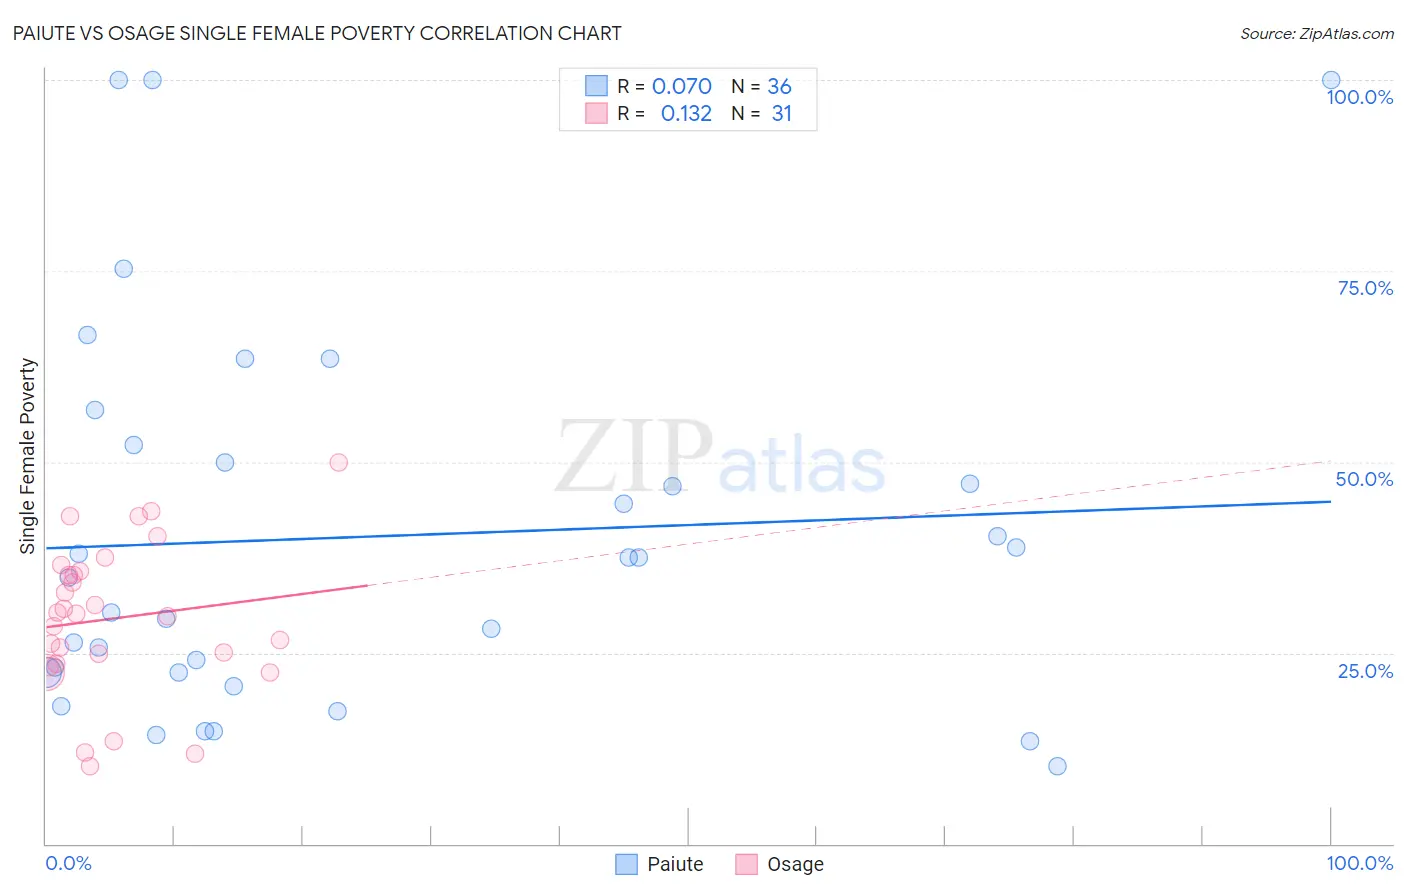
Paiute vs Osage Single Female Poverty Correlation Chart
The statistical analysis conducted on geographies consisting of 58,262,204 people shows a slight positive correlation between the proportion of Paiute and poverty level among single females in the United States with a correlation coefficient (R) of 0.070 and weighted average of 25.5%. Similarly, the statistical analysis conducted on geographies consisting of 91,495,293 people shows a poor positive correlation between the proportion of Osage and poverty level among single females in the United States with a correlation coefficient (R) of 0.132 and weighted average of 24.4%, a difference of 4.6%.
Single Female Poverty Correlation Summary
| Measurement | Paiute | Osage |
| Minimum | 10.1% | 10.2% |
| Maximum | 100.0% | 50.0% |
| Range | 89.9% | 39.8% |
| Mean | 40.2% | 29.5% |
| Median | 36.2% | 30.1% |
| Interquartile 25% (IQ1) | 22.3% | 23.6% |
| Interquartile 75% (IQ3) | 51.1% | 35.7% |
| Interquartile Range (IQR) | 28.8% | 12.1% |
| Standard Deviation (Sample) | 24.7% | 9.7% |
| Standard Deviation (Population) | 24.4% | 9.6% |
Similar Demographics by Single Female Poverty
Demographics Similar to Paiute by Single Female Poverty
In terms of single female poverty, the demographic groups most similar to Paiute are Immigrants from Honduras (25.5%, a difference of 0.050%), Comanche (25.6%, a difference of 0.11%), Central American Indian (25.5%, a difference of 0.33%), Cherokee (25.7%, a difference of 0.47%), and Dominican (25.4%, a difference of 0.48%).
| Demographics | Rating | Rank | Single Female Poverty |
| Immigrants | Dominican Republic | 0.0 /100 | #305 | Tragic 25.3% |
| Immigrants | Mexico | 0.0 /100 | #306 | Tragic 25.3% |
| Potawatomi | 0.0 /100 | #307 | Tragic 25.4% |
| Aleuts | 0.0 /100 | #308 | Tragic 25.4% |
| Dominicans | 0.0 /100 | #309 | Tragic 25.4% |
| Central American Indians | 0.0 /100 | #310 | Tragic 25.5% |
| Immigrants | Honduras | 0.0 /100 | #311 | Tragic 25.5% |
| Paiute | 0.0 /100 | #312 | Tragic 25.5% |
| Comanche | 0.0 /100 | #313 | Tragic 25.6% |
| Cherokee | 0.0 /100 | #314 | Tragic 25.7% |
| Iroquois | 0.0 /100 | #315 | Tragic 25.7% |
| Immigrants | Somalia | 0.0 /100 | #316 | Tragic 25.8% |
| Ottawa | 0.0 /100 | #317 | Tragic 26.0% |
| Chickasaw | 0.0 /100 | #318 | Tragic 26.3% |
| Blacks/African Americans | 0.0 /100 | #319 | Tragic 26.4% |
Demographics Similar to Osage by Single Female Poverty
In terms of single female poverty, the demographic groups most similar to Osage are Alsatian (24.5%, a difference of 0.37%), American (24.5%, a difference of 0.44%), French American Indian (24.6%, a difference of 0.59%), Indonesian (24.3%, a difference of 0.60%), and U.S. Virgin Islander (24.2%, a difference of 0.94%).
| Demographics | Rating | Rank | Single Female Poverty |
| Immigrants | Dominica | 0.0 /100 | #284 | Tragic 23.9% |
| Immigrants | Guatemala | 0.0 /100 | #285 | Tragic 24.1% |
| Cree | 0.0 /100 | #286 | Tragic 24.1% |
| Bangladeshis | 0.0 /100 | #287 | Tragic 24.2% |
| Spanish Americans | 0.0 /100 | #288 | Tragic 24.2% |
| U.S. Virgin Islanders | 0.0 /100 | #289 | Tragic 24.2% |
| Indonesians | 0.0 /100 | #290 | Tragic 24.3% |
| Osage | 0.0 /100 | #291 | Tragic 24.4% |
| Alsatians | 0.0 /100 | #292 | Tragic 24.5% |
| Americans | 0.0 /100 | #293 | Tragic 24.5% |
| French American Indians | 0.0 /100 | #294 | Tragic 24.6% |
| Hispanics or Latinos | 0.0 /100 | #295 | Tragic 24.6% |
| Africans | 0.0 /100 | #296 | Tragic 24.8% |
| Immigrants | Central America | 0.0 /100 | #297 | Tragic 24.8% |
| Yaqui | 0.0 /100 | #298 | Tragic 24.9% |