Paiute vs Laotian Single Female Poverty
COMPARE
Paiute
Laotian
Single Female Poverty
Single Female Poverty Comparison
Paiute
Laotians
25.5%
SINGLE FEMALE POVERTY
0.0/ 100
METRIC RATING
312th/ 347
METRIC RANK
19.3%
SINGLE FEMALE POVERTY
99.5/ 100
METRIC RATING
68th/ 347
METRIC RANK
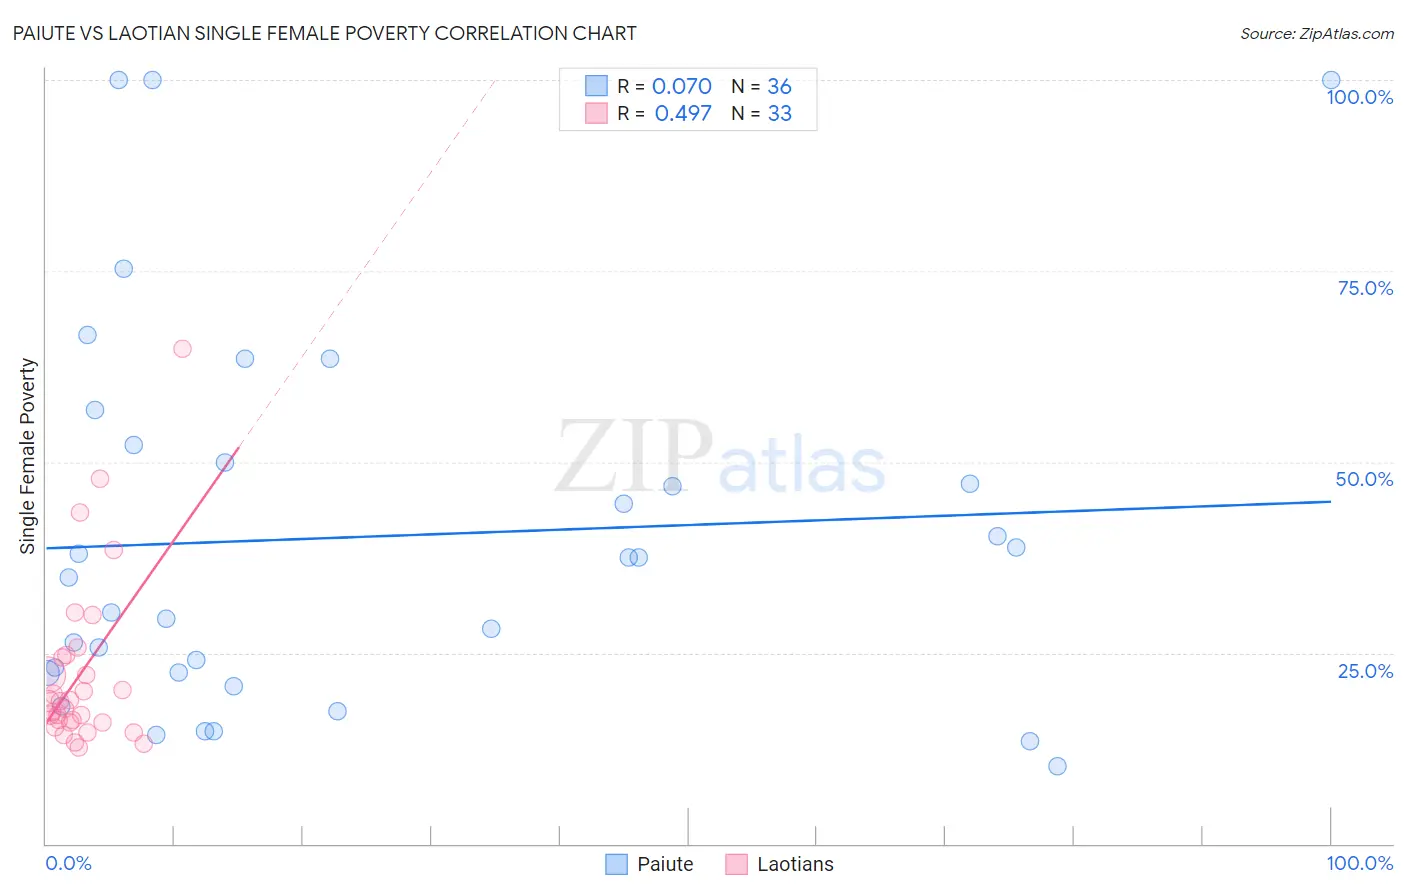
Paiute vs Laotian Single Female Poverty Correlation Chart
The statistical analysis conducted on geographies consisting of 58,262,204 people shows a slight positive correlation between the proportion of Paiute and poverty level among single females in the United States with a correlation coefficient (R) of 0.070 and weighted average of 25.5%. Similarly, the statistical analysis conducted on geographies consisting of 222,876,805 people shows a moderate positive correlation between the proportion of Laotians and poverty level among single females in the United States with a correlation coefficient (R) of 0.497 and weighted average of 19.3%, a difference of 32.7%.
Single Female Poverty Correlation Summary
| Measurement | Paiute | Laotian |
| Minimum | 10.1% | 12.6% |
| Maximum | 100.0% | 64.9% |
| Range | 89.9% | 52.3% |
| Mean | 40.2% | 22.3% |
| Median | 36.2% | 18.7% |
| Interquartile 25% (IQ1) | 22.3% | 15.9% |
| Interquartile 75% (IQ3) | 51.1% | 24.6% |
| Interquartile Range (IQR) | 28.8% | 8.7% |
| Standard Deviation (Sample) | 24.7% | 11.4% |
| Standard Deviation (Population) | 24.4% | 11.2% |
Similar Demographics by Single Female Poverty
Demographics Similar to Paiute by Single Female Poverty
In terms of single female poverty, the demographic groups most similar to Paiute are Immigrants from Honduras (25.5%, a difference of 0.050%), Comanche (25.6%, a difference of 0.11%), Central American Indian (25.5%, a difference of 0.33%), Cherokee (25.7%, a difference of 0.47%), and Dominican (25.4%, a difference of 0.48%).
| Demographics | Rating | Rank | Single Female Poverty |
| Immigrants | Dominican Republic | 0.0 /100 | #305 | Tragic 25.3% |
| Immigrants | Mexico | 0.0 /100 | #306 | Tragic 25.3% |
| Potawatomi | 0.0 /100 | #307 | Tragic 25.4% |
| Aleuts | 0.0 /100 | #308 | Tragic 25.4% |
| Dominicans | 0.0 /100 | #309 | Tragic 25.4% |
| Central American Indians | 0.0 /100 | #310 | Tragic 25.5% |
| Immigrants | Honduras | 0.0 /100 | #311 | Tragic 25.5% |
| Paiute | 0.0 /100 | #312 | Tragic 25.5% |
| Comanche | 0.0 /100 | #313 | Tragic 25.6% |
| Cherokee | 0.0 /100 | #314 | Tragic 25.7% |
| Iroquois | 0.0 /100 | #315 | Tragic 25.7% |
| Immigrants | Somalia | 0.0 /100 | #316 | Tragic 25.8% |
| Ottawa | 0.0 /100 | #317 | Tragic 26.0% |
| Chickasaw | 0.0 /100 | #318 | Tragic 26.3% |
| Blacks/African Americans | 0.0 /100 | #319 | Tragic 26.4% |
Demographics Similar to Laotians by Single Female Poverty
In terms of single female poverty, the demographic groups most similar to Laotians are Immigrants from Egypt (19.2%, a difference of 0.040%), Palestinian (19.2%, a difference of 0.080%), Cypriot (19.2%, a difference of 0.10%), Immigrants from Europe (19.2%, a difference of 0.12%), and Immigrants from Northern Europe (19.2%, a difference of 0.13%).
| Demographics | Rating | Rank | Single Female Poverty |
| Cambodians | 99.6 /100 | #61 | Exceptional 19.2% |
| Lithuanians | 99.6 /100 | #62 | Exceptional 19.2% |
| Immigrants | Northern Europe | 99.6 /100 | #63 | Exceptional 19.2% |
| Immigrants | Europe | 99.6 /100 | #64 | Exceptional 19.2% |
| Cypriots | 99.6 /100 | #65 | Exceptional 19.2% |
| Palestinians | 99.6 /100 | #66 | Exceptional 19.2% |
| Immigrants | Egypt | 99.6 /100 | #67 | Exceptional 19.2% |
| Laotians | 99.5 /100 | #68 | Exceptional 19.3% |
| Paraguayans | 99.5 /100 | #69 | Exceptional 19.3% |
| Immigrants | Jordan | 99.4 /100 | #70 | Exceptional 19.3% |
| Immigrants | South Eastern Asia | 99.4 /100 | #71 | Exceptional 19.3% |
| Immigrants | Latvia | 99.4 /100 | #72 | Exceptional 19.3% |
| Immigrants | Peru | 99.4 /100 | #73 | Exceptional 19.3% |
| Immigrants | Belarus | 99.4 /100 | #74 | Exceptional 19.3% |
| Immigrants | Turkey | 99.4 /100 | #75 | Exceptional 19.4% |