Osage vs Cherokee Single Female Poverty
COMPARE
Osage
Cherokee
Single Female Poverty
Single Female Poverty Comparison
Osage
Cherokee
24.4%
SINGLE FEMALE POVERTY
0.0/ 100
METRIC RATING
291st/ 347
METRIC RANK
25.7%
SINGLE FEMALE POVERTY
0.0/ 100
METRIC RATING
314th/ 347
METRIC RANK
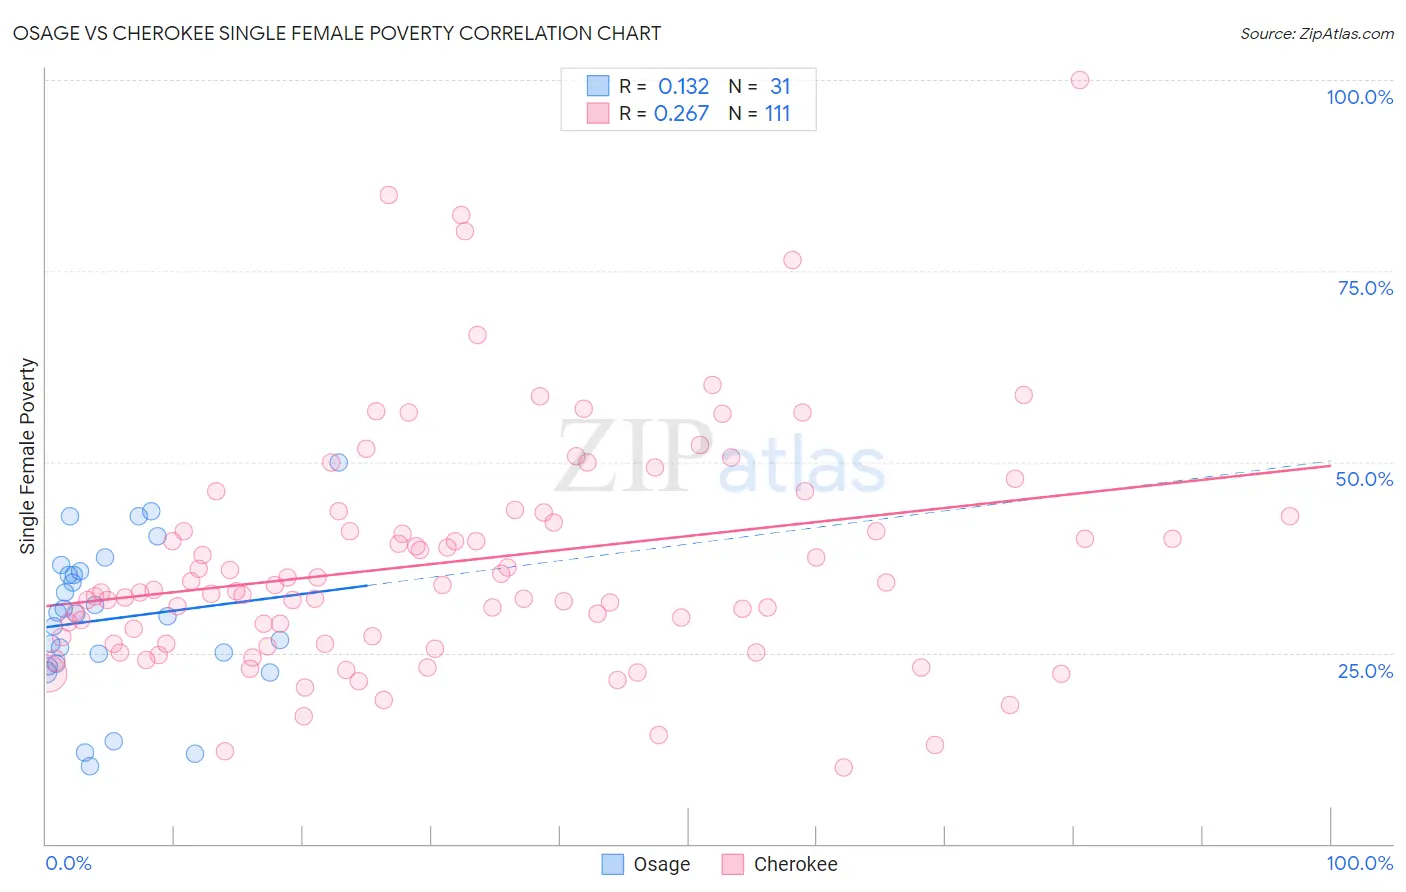
Osage vs Cherokee Single Female Poverty Correlation Chart
The statistical analysis conducted on geographies consisting of 91,495,293 people shows a poor positive correlation between the proportion of Osage and poverty level among single females in the United States with a correlation coefficient (R) of 0.132 and weighted average of 24.4%. Similarly, the statistical analysis conducted on geographies consisting of 484,754,756 people shows a weak positive correlation between the proportion of Cherokee and poverty level among single females in the United States with a correlation coefficient (R) of 0.267 and weighted average of 25.7%, a difference of 5.1%.
Single Female Poverty Correlation Summary
| Measurement | Osage | Cherokee |
| Minimum | 10.2% | 10.0% |
| Maximum | 50.0% | 100.0% |
| Range | 39.8% | 90.0% |
| Mean | 29.5% | 37.0% |
| Median | 30.1% | 33.1% |
| Interquartile 25% (IQ1) | 23.6% | 26.2% |
| Interquartile 75% (IQ3) | 35.7% | 42.9% |
| Interquartile Range (IQR) | 12.1% | 16.6% |
| Standard Deviation (Sample) | 9.7% | 15.5% |
| Standard Deviation (Population) | 9.6% | 15.4% |
Similar Demographics by Single Female Poverty
Demographics Similar to Osage by Single Female Poverty
In terms of single female poverty, the demographic groups most similar to Osage are Alsatian (24.5%, a difference of 0.37%), American (24.5%, a difference of 0.44%), French American Indian (24.6%, a difference of 0.59%), Indonesian (24.3%, a difference of 0.60%), and U.S. Virgin Islander (24.2%, a difference of 0.94%).
| Demographics | Rating | Rank | Single Female Poverty |
| Immigrants | Dominica | 0.0 /100 | #284 | Tragic 23.9% |
| Immigrants | Guatemala | 0.0 /100 | #285 | Tragic 24.1% |
| Cree | 0.0 /100 | #286 | Tragic 24.1% |
| Bangladeshis | 0.0 /100 | #287 | Tragic 24.2% |
| Spanish Americans | 0.0 /100 | #288 | Tragic 24.2% |
| U.S. Virgin Islanders | 0.0 /100 | #289 | Tragic 24.2% |
| Indonesians | 0.0 /100 | #290 | Tragic 24.3% |
| Osage | 0.0 /100 | #291 | Tragic 24.4% |
| Alsatians | 0.0 /100 | #292 | Tragic 24.5% |
| Americans | 0.0 /100 | #293 | Tragic 24.5% |
| French American Indians | 0.0 /100 | #294 | Tragic 24.6% |
| Hispanics or Latinos | 0.0 /100 | #295 | Tragic 24.6% |
| Africans | 0.0 /100 | #296 | Tragic 24.8% |
| Immigrants | Central America | 0.0 /100 | #297 | Tragic 24.8% |
| Yaqui | 0.0 /100 | #298 | Tragic 24.9% |
Demographics Similar to Cherokee by Single Female Poverty
In terms of single female poverty, the demographic groups most similar to Cherokee are Iroquois (25.7%, a difference of 0.32%), Comanche (25.6%, a difference of 0.36%), Paiute (25.5%, a difference of 0.47%), Immigrants from Somalia (25.8%, a difference of 0.47%), and Immigrants from Honduras (25.5%, a difference of 0.51%).
| Demographics | Rating | Rank | Single Female Poverty |
| Potawatomi | 0.0 /100 | #307 | Tragic 25.4% |
| Aleuts | 0.0 /100 | #308 | Tragic 25.4% |
| Dominicans | 0.0 /100 | #309 | Tragic 25.4% |
| Central American Indians | 0.0 /100 | #310 | Tragic 25.5% |
| Immigrants | Honduras | 0.0 /100 | #311 | Tragic 25.5% |
| Paiute | 0.0 /100 | #312 | Tragic 25.5% |
| Comanche | 0.0 /100 | #313 | Tragic 25.6% |
| Cherokee | 0.0 /100 | #314 | Tragic 25.7% |
| Iroquois | 0.0 /100 | #315 | Tragic 25.7% |
| Immigrants | Somalia | 0.0 /100 | #316 | Tragic 25.8% |
| Ottawa | 0.0 /100 | #317 | Tragic 26.0% |
| Chickasaw | 0.0 /100 | #318 | Tragic 26.3% |
| Blacks/African Americans | 0.0 /100 | #319 | Tragic 26.4% |
| Arapaho | 0.0 /100 | #320 | Tragic 26.4% |
| Yup'ik | 0.0 /100 | #321 | Tragic 26.6% |