Osage vs Dutch Single Female Poverty
COMPARE
Osage
Dutch
Single Female Poverty
Single Female Poverty Comparison
Osage
Dutch
24.4%
SINGLE FEMALE POVERTY
0.0/ 100
METRIC RATING
291st/ 347
METRIC RANK
22.0%
SINGLE FEMALE POVERTY
4.6/ 100
METRIC RATING
235th/ 347
METRIC RANK
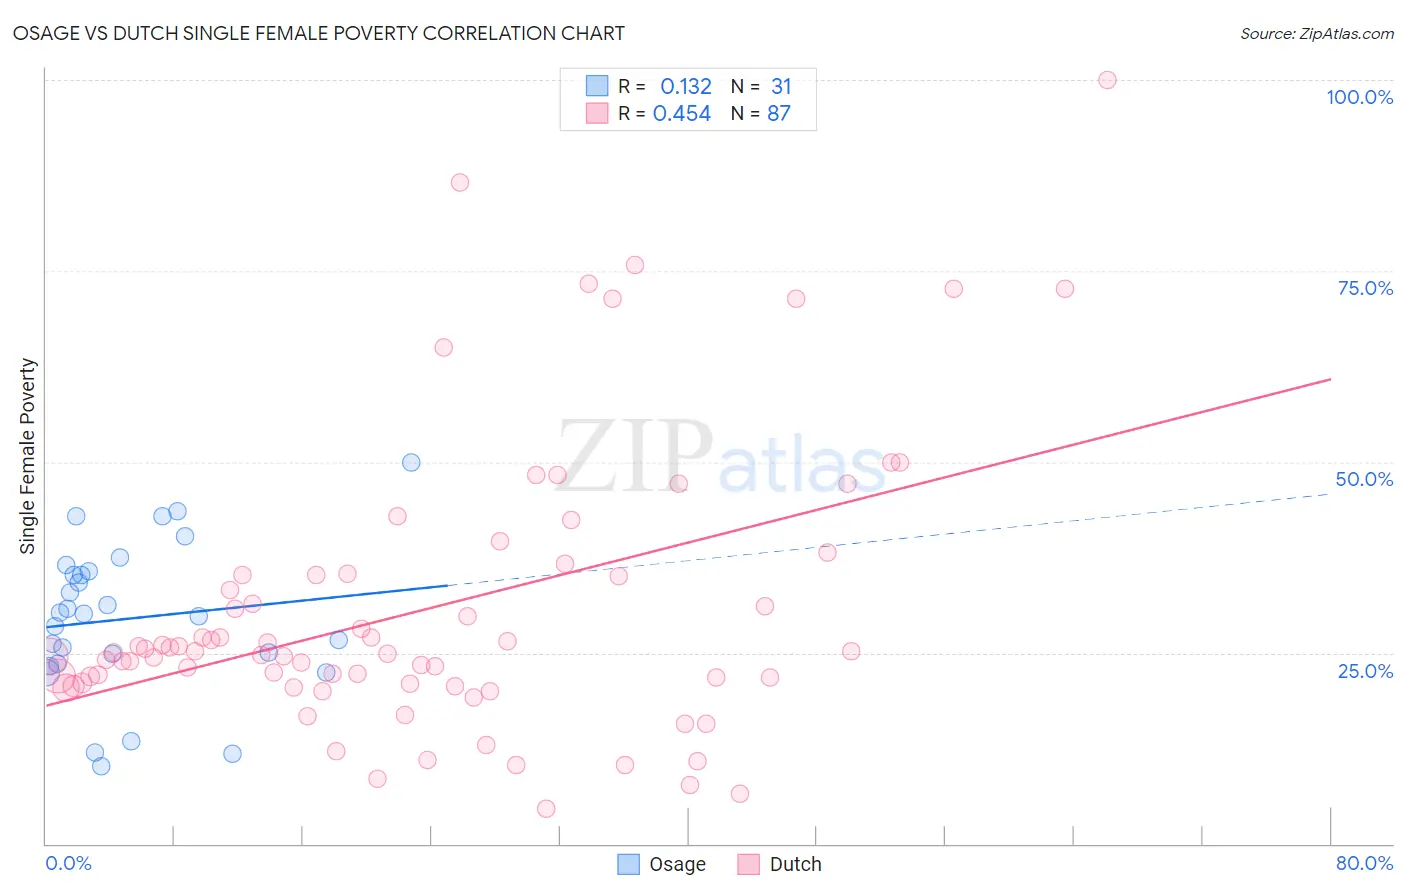
Osage vs Dutch Single Female Poverty Correlation Chart
The statistical analysis conducted on geographies consisting of 91,495,293 people shows a poor positive correlation between the proportion of Osage and poverty level among single females in the United States with a correlation coefficient (R) of 0.132 and weighted average of 24.4%. Similarly, the statistical analysis conducted on geographies consisting of 536,025,433 people shows a moderate positive correlation between the proportion of Dutch and poverty level among single females in the United States with a correlation coefficient (R) of 0.454 and weighted average of 22.0%, a difference of 10.9%.
Single Female Poverty Correlation Summary
| Measurement | Osage | Dutch |
| Minimum | 10.2% | 4.6% |
| Maximum | 50.0% | 100.0% |
| Range | 39.8% | 95.4% |
| Mean | 29.5% | 30.8% |
| Median | 30.1% | 25.0% |
| Interquartile 25% (IQ1) | 23.6% | 20.9% |
| Interquartile 75% (IQ3) | 35.7% | 35.2% |
| Interquartile Range (IQR) | 12.1% | 14.3% |
| Standard Deviation (Sample) | 9.7% | 18.7% |
| Standard Deviation (Population) | 9.6% | 18.6% |
Similar Demographics by Single Female Poverty
Demographics Similar to Osage by Single Female Poverty
In terms of single female poverty, the demographic groups most similar to Osage are Alsatian (24.5%, a difference of 0.37%), American (24.5%, a difference of 0.44%), French American Indian (24.6%, a difference of 0.59%), Indonesian (24.3%, a difference of 0.60%), and U.S. Virgin Islander (24.2%, a difference of 0.94%).
| Demographics | Rating | Rank | Single Female Poverty |
| Immigrants | Dominica | 0.0 /100 | #284 | Tragic 23.9% |
| Immigrants | Guatemala | 0.0 /100 | #285 | Tragic 24.1% |
| Cree | 0.0 /100 | #286 | Tragic 24.1% |
| Bangladeshis | 0.0 /100 | #287 | Tragic 24.2% |
| Spanish Americans | 0.0 /100 | #288 | Tragic 24.2% |
| U.S. Virgin Islanders | 0.0 /100 | #289 | Tragic 24.2% |
| Indonesians | 0.0 /100 | #290 | Tragic 24.3% |
| Osage | 0.0 /100 | #291 | Tragic 24.4% |
| Alsatians | 0.0 /100 | #292 | Tragic 24.5% |
| Americans | 0.0 /100 | #293 | Tragic 24.5% |
| French American Indians | 0.0 /100 | #294 | Tragic 24.6% |
| Hispanics or Latinos | 0.0 /100 | #295 | Tragic 24.6% |
| Africans | 0.0 /100 | #296 | Tragic 24.8% |
| Immigrants | Central America | 0.0 /100 | #297 | Tragic 24.8% |
| Yaqui | 0.0 /100 | #298 | Tragic 24.9% |
Demographics Similar to Dutch by Single Female Poverty
In terms of single female poverty, the demographic groups most similar to Dutch are Spaniard (22.0%, a difference of 0.020%), Spanish (22.0%, a difference of 0.020%), Immigrants from Thailand (22.0%, a difference of 0.12%), Welsh (22.0%, a difference of 0.13%), and Immigrants from Ecuador (22.0%, a difference of 0.16%).
| Demographics | Rating | Rank | Single Female Poverty |
| Salvadorans | 5.5 /100 | #228 | Tragic 21.9% |
| Tlingit-Haida | 5.4 /100 | #229 | Tragic 21.9% |
| Immigrants | Western Africa | 5.3 /100 | #230 | Tragic 22.0% |
| Welsh | 5.0 /100 | #231 | Tragic 22.0% |
| Immigrants | Thailand | 5.0 /100 | #232 | Tragic 22.0% |
| Spaniards | 4.7 /100 | #233 | Tragic 22.0% |
| Spanish | 4.7 /100 | #234 | Tragic 22.0% |
| Dutch | 4.6 /100 | #235 | Tragic 22.0% |
| Immigrants | Ecuador | 4.2 /100 | #236 | Tragic 22.0% |
| Vietnamese | 4.0 /100 | #237 | Tragic 22.0% |
| French Canadians | 2.8 /100 | #238 | Tragic 22.2% |
| Malaysians | 2.8 /100 | #239 | Tragic 22.2% |
| French | 2.3 /100 | #240 | Tragic 22.2% |
| Cape Verdeans | 2.1 /100 | #241 | Tragic 22.3% |
| Bermudans | 2.0 /100 | #242 | Tragic 22.3% |