Osage vs Cherokee In Labor Force | Age 20-64
COMPARE
Osage
Cherokee
In Labor Force | Age 20-64
In Labor Force | Age 20-64 Comparison
Osage
Cherokee
78.0%
IN LABOR FORCE | AGE 20-64
0.0/ 100
METRIC RATING
285th/ 347
METRIC RANK
76.2%
IN LABOR FORCE | AGE 20-64
0.0/ 100
METRIC RATING
317th/ 347
METRIC RANK
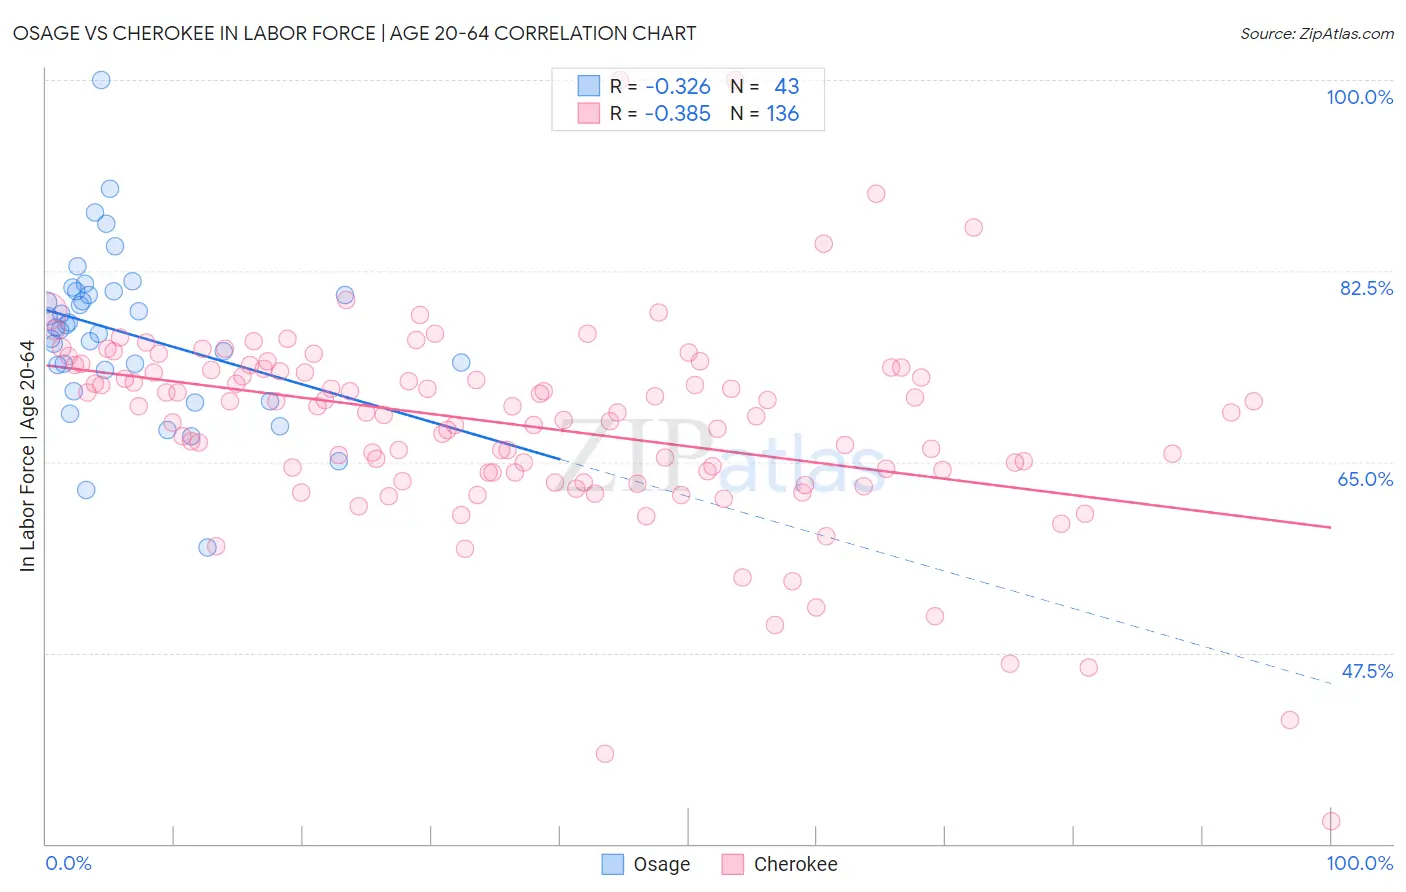
Osage vs Cherokee In Labor Force | Age 20-64 Correlation Chart
The statistical analysis conducted on geographies consisting of 91,799,408 people shows a mild negative correlation between the proportion of Osage and labor force participation rate among population between the ages 20 and 64 in the United States with a correlation coefficient (R) of -0.326 and weighted average of 78.0%. Similarly, the statistical analysis conducted on geographies consisting of 493,680,494 people shows a mild negative correlation between the proportion of Cherokee and labor force participation rate among population between the ages 20 and 64 in the United States with a correlation coefficient (R) of -0.385 and weighted average of 76.2%, a difference of 2.3%.
In Labor Force | Age 20-64 Correlation Summary
| Measurement | Osage | Cherokee |
| Minimum | 57.1% | 32.1% |
| Maximum | 100.0% | 100.0% |
| Range | 42.9% | 67.9% |
| Mean | 76.8% | 68.4% |
| Median | 77.4% | 69.6% |
| Interquartile 25% (IQ1) | 73.5% | 64.0% |
| Interquartile 75% (IQ3) | 80.7% | 73.5% |
| Interquartile Range (IQR) | 7.2% | 9.5% |
| Standard Deviation (Sample) | 7.5% | 9.3% |
| Standard Deviation (Population) | 7.4% | 9.3% |
Similar Demographics by In Labor Force | Age 20-64
Demographics Similar to Osage by In Labor Force | Age 20-64
In terms of in labor force | age 20-64, the demographic groups most similar to Osage are Immigrants from Belize (78.0%, a difference of 0.010%), Vietnamese (78.0%, a difference of 0.010%), Hmong (77.9%, a difference of 0.090%), Immigrants from Guyana (78.1%, a difference of 0.10%), and African (77.9%, a difference of 0.10%).
| Demographics | Rating | Rank | In Labor Force | Age 20-64 |
| Mexican American Indians | 0.0 /100 | #278 | Tragic 78.2% |
| Belizeans | 0.0 /100 | #279 | Tragic 78.2% |
| Immigrants | Dominica | 0.0 /100 | #280 | Tragic 78.1% |
| Guyanese | 0.0 /100 | #281 | Tragic 78.1% |
| Immigrants | St. Vincent and the Grenadines | 0.0 /100 | #282 | Tragic 78.1% |
| Immigrants | Nonimmigrants | 0.0 /100 | #283 | Tragic 78.1% |
| Immigrants | Guyana | 0.0 /100 | #284 | Tragic 78.1% |
| Osage | 0.0 /100 | #285 | Tragic 78.0% |
| Immigrants | Belize | 0.0 /100 | #286 | Tragic 78.0% |
| Vietnamese | 0.0 /100 | #287 | Tragic 78.0% |
| Hmong | 0.0 /100 | #288 | Tragic 77.9% |
| Africans | 0.0 /100 | #289 | Tragic 77.9% |
| Immigrants | Bangladesh | 0.0 /100 | #290 | Tragic 77.9% |
| Spanish Americans | 0.0 /100 | #291 | Tragic 77.8% |
| Immigrants | Azores | 0.0 /100 | #292 | Tragic 77.8% |
Demographics Similar to Cherokee by In Labor Force | Age 20-64
In terms of in labor force | age 20-64, the demographic groups most similar to Cherokee are Chickasaw (76.2%, a difference of 0.040%), Inupiat (76.1%, a difference of 0.21%), Yaqui (76.5%, a difference of 0.40%), Ottawa (76.7%, a difference of 0.59%), and Yakama (75.8%, a difference of 0.59%).
| Demographics | Rating | Rank | In Labor Force | Age 20-64 |
| Comanche | 0.0 /100 | #310 | Tragic 77.0% |
| Blackfeet | 0.0 /100 | #311 | Tragic 77.0% |
| Alaskan Athabascans | 0.0 /100 | #312 | Tragic 76.9% |
| Shoshone | 0.0 /100 | #313 | Tragic 76.8% |
| Blacks/African Americans | 0.0 /100 | #314 | Tragic 76.8% |
| Ottawa | 0.0 /100 | #315 | Tragic 76.7% |
| Yaqui | 0.0 /100 | #316 | Tragic 76.5% |
| Cherokee | 0.0 /100 | #317 | Tragic 76.2% |
| Chickasaw | 0.0 /100 | #318 | Tragic 76.2% |
| Inupiat | 0.0 /100 | #319 | Tragic 76.1% |
| Yakama | 0.0 /100 | #320 | Tragic 75.8% |
| Seminole | 0.0 /100 | #321 | Tragic 75.5% |
| Dutch West Indians | 0.0 /100 | #322 | Tragic 75.5% |
| Cajuns | 0.0 /100 | #323 | Tragic 75.5% |
| Choctaw | 0.0 /100 | #324 | Tragic 75.4% |