Osage vs Cherokee In Labor Force | Age 45-54
COMPARE
Osage
Cherokee
In Labor Force | Age 45-54
In Labor Force | Age 45-54 Comparison
Osage
Cherokee
80.6%
IN LABOR FORCE | AGE 45-54
0.0/ 100
METRIC RATING
293rd/ 347
METRIC RANK
79.0%
IN LABOR FORCE | AGE 45-54
0.0/ 100
METRIC RATING
319th/ 347
METRIC RANK
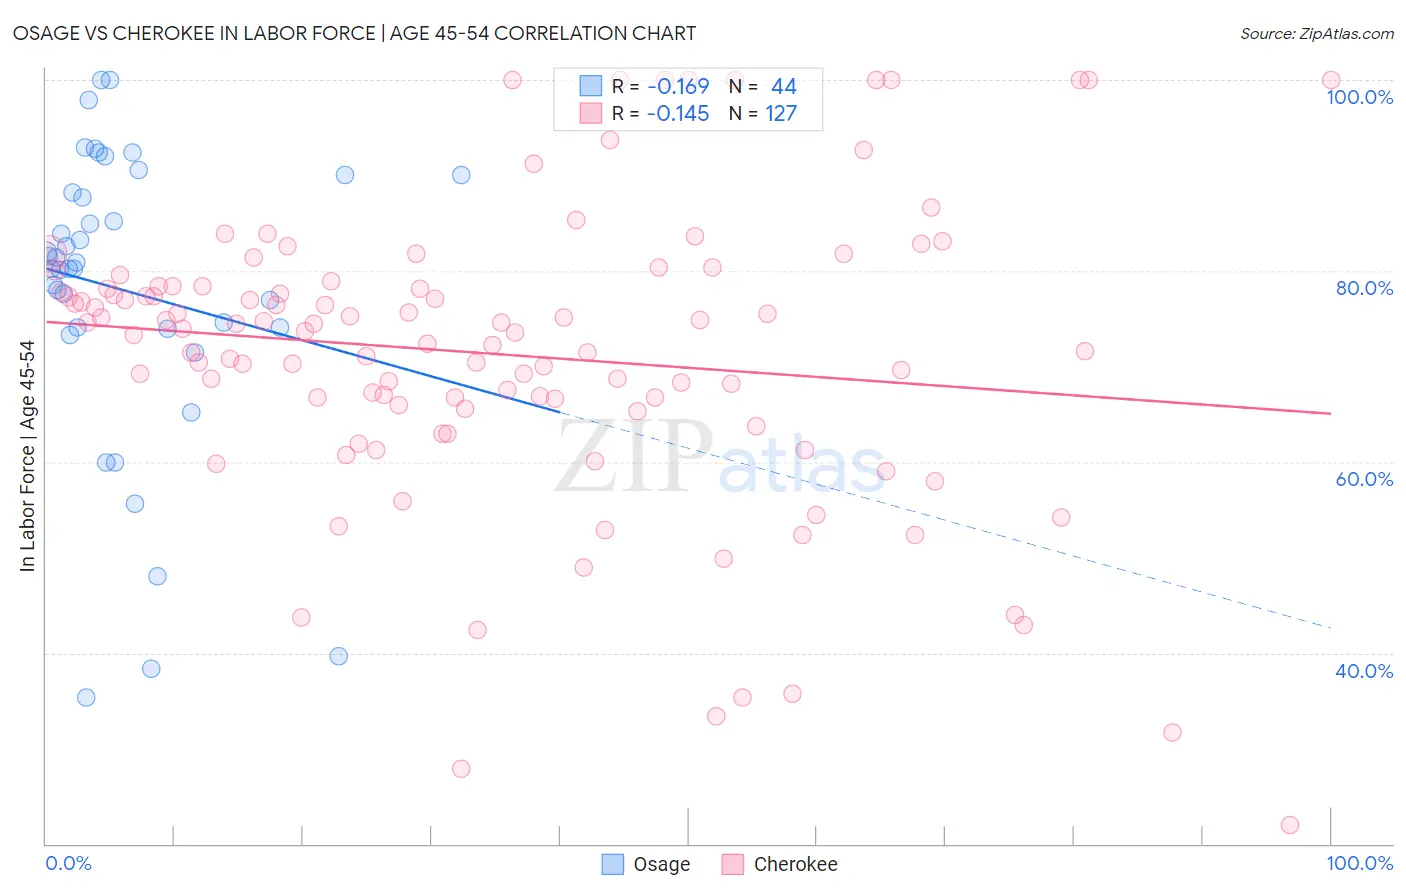
Osage vs Cherokee In Labor Force | Age 45-54 Correlation Chart
The statistical analysis conducted on geographies consisting of 91,796,641 people shows a poor negative correlation between the proportion of Osage and labor force participation rate among population between the ages 45 and 54 in the United States with a correlation coefficient (R) of -0.169 and weighted average of 80.6%. Similarly, the statistical analysis conducted on geographies consisting of 493,314,993 people shows a poor negative correlation between the proportion of Cherokee and labor force participation rate among population between the ages 45 and 54 in the United States with a correlation coefficient (R) of -0.145 and weighted average of 79.0%, a difference of 2.1%.
In Labor Force | Age 45-54 Correlation Summary
| Measurement | Osage | Cherokee |
| Minimum | 35.3% | 21.9% |
| Maximum | 100.0% | 100.0% |
| Range | 64.7% | 78.1% |
| Mean | 77.9% | 71.3% |
| Median | 80.6% | 73.7% |
| Interquartile 25% (IQ1) | 74.0% | 65.6% |
| Interquartile 75% (IQ3) | 89.1% | 78.4% |
| Interquartile Range (IQR) | 15.1% | 12.8% |
| Standard Deviation (Sample) | 15.6% | 15.5% |
| Standard Deviation (Population) | 15.5% | 15.5% |
Similar Demographics by In Labor Force | Age 45-54
Demographics Similar to Osage by In Labor Force | Age 45-54
In terms of in labor force | age 45-54, the demographic groups most similar to Osage are Yakama (80.6%, a difference of 0.0%), Iroquois (80.6%, a difference of 0.020%), Immigrants from Belize (80.6%, a difference of 0.050%), Nepalese (80.5%, a difference of 0.070%), and African (80.5%, a difference of 0.10%).
| Demographics | Rating | Rank | In Labor Force | Age 45-54 |
| Immigrants | Dominica | 0.0 /100 | #286 | Tragic 80.8% |
| Vietnamese | 0.0 /100 | #287 | Tragic 80.8% |
| Cree | 0.0 /100 | #288 | Tragic 80.8% |
| Immigrants | Bangladesh | 0.0 /100 | #289 | Tragic 80.7% |
| Mexican American Indians | 0.0 /100 | #290 | Tragic 80.7% |
| Immigrants | Belize | 0.0 /100 | #291 | Tragic 80.6% |
| Iroquois | 0.0 /100 | #292 | Tragic 80.6% |
| Osage | 0.0 /100 | #293 | Tragic 80.6% |
| Yakama | 0.0 /100 | #294 | Tragic 80.6% |
| Nepalese | 0.0 /100 | #295 | Tragic 80.5% |
| Africans | 0.0 /100 | #296 | Tragic 80.5% |
| Americans | 0.0 /100 | #297 | Tragic 80.4% |
| Marshallese | 0.0 /100 | #298 | Tragic 80.3% |
| Dominicans | 0.0 /100 | #299 | Tragic 80.3% |
| Fijians | 0.0 /100 | #300 | Tragic 80.2% |
Demographics Similar to Cherokee by In Labor Force | Age 45-54
In terms of in labor force | age 45-54, the demographic groups most similar to Cherokee are Chickasaw (79.0%, a difference of 0.10%), Yaqui (78.9%, a difference of 0.10%), Comanche (79.2%, a difference of 0.28%), Yup'ik (78.6%, a difference of 0.40%), and Shoshone (79.3%, a difference of 0.41%).
| Demographics | Rating | Rank | In Labor Force | Age 45-54 |
| Immigrants | Mexico | 0.0 /100 | #312 | Tragic 79.7% |
| Colville | 0.0 /100 | #313 | Tragic 79.5% |
| Ottawa | 0.0 /100 | #314 | Tragic 79.5% |
| Blacks/African Americans | 0.0 /100 | #315 | Tragic 79.3% |
| Shoshone | 0.0 /100 | #316 | Tragic 79.3% |
| Comanche | 0.0 /100 | #317 | Tragic 79.2% |
| Chickasaw | 0.0 /100 | #318 | Tragic 79.0% |
| Cherokee | 0.0 /100 | #319 | Tragic 79.0% |
| Yaqui | 0.0 /100 | #320 | Tragic 78.9% |
| Yup'ik | 0.0 /100 | #321 | Tragic 78.6% |
| Crow | 0.0 /100 | #322 | Tragic 78.3% |
| Kiowa | 0.0 /100 | #323 | Tragic 78.3% |
| Dutch West Indians | 0.0 /100 | #324 | Tragic 78.2% |
| Choctaw | 0.0 /100 | #325 | Tragic 78.2% |
| Seminole | 0.0 /100 | #326 | Tragic 78.1% |