Osage vs Immigrants from El Salvador Single Female Poverty
COMPARE
Osage
Immigrants from El Salvador
Single Female Poverty
Single Female Poverty Comparison
Osage
Immigrants from El Salvador
24.4%
SINGLE FEMALE POVERTY
0.0/ 100
METRIC RATING
291st/ 347
METRIC RANK
22.4%
SINGLE FEMALE POVERTY
1.4/ 100
METRIC RATING
247th/ 347
METRIC RANK
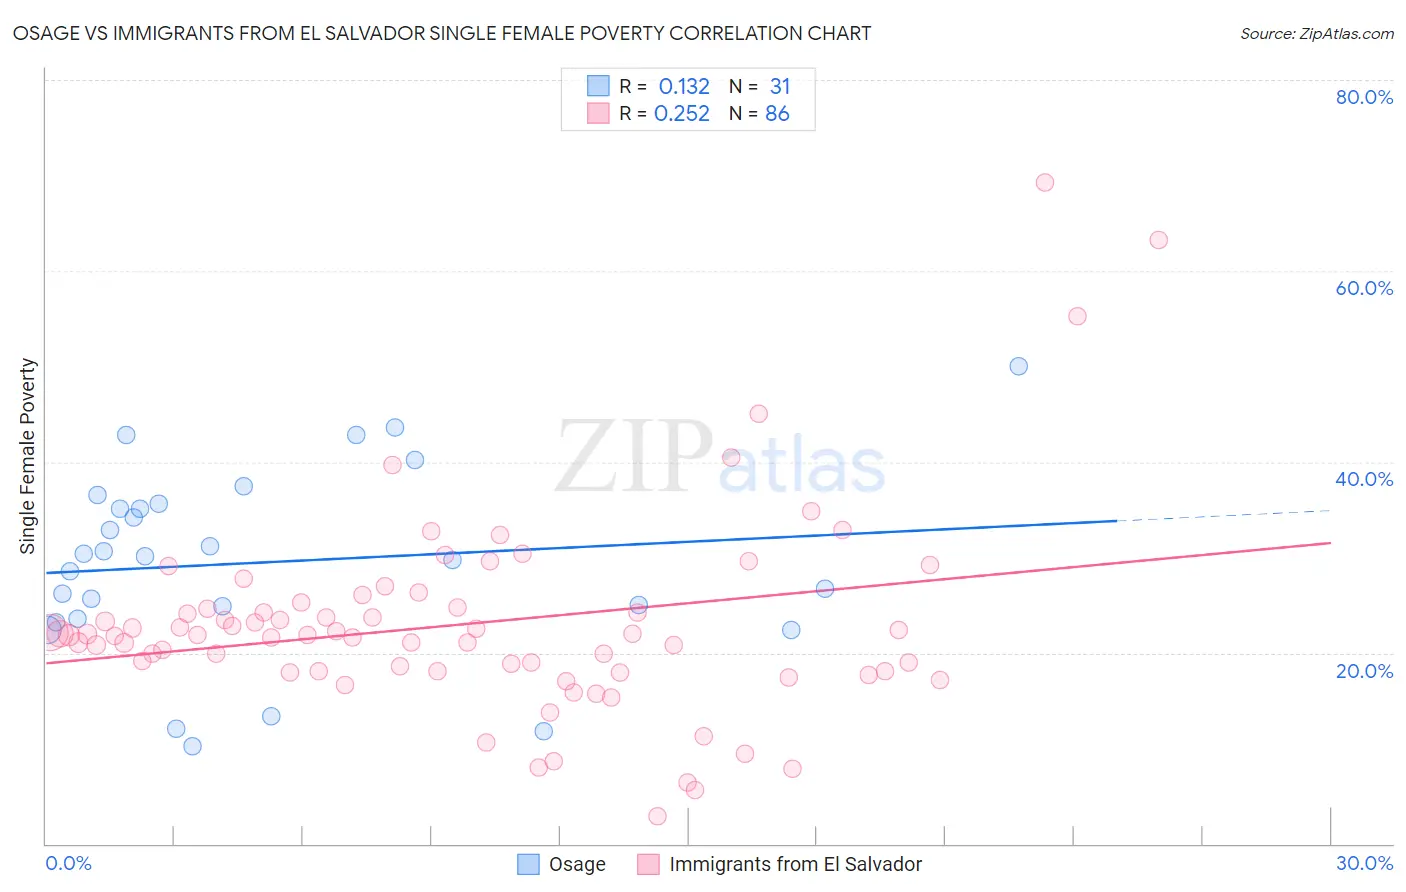
Osage vs Immigrants from El Salvador Single Female Poverty Correlation Chart
The statistical analysis conducted on geographies consisting of 91,495,293 people shows a poor positive correlation between the proportion of Osage and poverty level among single females in the United States with a correlation coefficient (R) of 0.132 and weighted average of 24.4%. Similarly, the statistical analysis conducted on geographies consisting of 354,692,834 people shows a weak positive correlation between the proportion of Immigrants from El Salvador and poverty level among single females in the United States with a correlation coefficient (R) of 0.252 and weighted average of 22.4%, a difference of 8.9%.
Single Female Poverty Correlation Summary
| Measurement | Osage | Immigrants from El Salvador |
| Minimum | 10.2% | 2.9% |
| Maximum | 50.0% | 69.3% |
| Range | 39.8% | 66.4% |
| Mean | 29.5% | 23.0% |
| Median | 30.1% | 21.9% |
| Interquartile 25% (IQ1) | 23.6% | 18.1% |
| Interquartile 75% (IQ3) | 35.7% | 24.8% |
| Interquartile Range (IQR) | 12.1% | 6.6% |
| Standard Deviation (Sample) | 9.7% | 10.5% |
| Standard Deviation (Population) | 9.6% | 10.5% |
Similar Demographics by Single Female Poverty
Demographics Similar to Osage by Single Female Poverty
In terms of single female poverty, the demographic groups most similar to Osage are Alsatian (24.5%, a difference of 0.37%), American (24.5%, a difference of 0.44%), French American Indian (24.6%, a difference of 0.59%), Indonesian (24.3%, a difference of 0.60%), and U.S. Virgin Islander (24.2%, a difference of 0.94%).
| Demographics | Rating | Rank | Single Female Poverty |
| Immigrants | Dominica | 0.0 /100 | #284 | Tragic 23.9% |
| Immigrants | Guatemala | 0.0 /100 | #285 | Tragic 24.1% |
| Cree | 0.0 /100 | #286 | Tragic 24.1% |
| Bangladeshis | 0.0 /100 | #287 | Tragic 24.2% |
| Spanish Americans | 0.0 /100 | #288 | Tragic 24.2% |
| U.S. Virgin Islanders | 0.0 /100 | #289 | Tragic 24.2% |
| Indonesians | 0.0 /100 | #290 | Tragic 24.3% |
| Osage | 0.0 /100 | #291 | Tragic 24.4% |
| Alsatians | 0.0 /100 | #292 | Tragic 24.5% |
| Americans | 0.0 /100 | #293 | Tragic 24.5% |
| French American Indians | 0.0 /100 | #294 | Tragic 24.6% |
| Hispanics or Latinos | 0.0 /100 | #295 | Tragic 24.6% |
| Africans | 0.0 /100 | #296 | Tragic 24.8% |
| Immigrants | Central America | 0.0 /100 | #297 | Tragic 24.8% |
| Yaqui | 0.0 /100 | #298 | Tragic 24.9% |
Demographics Similar to Immigrants from El Salvador by Single Female Poverty
In terms of single female poverty, the demographic groups most similar to Immigrants from El Salvador are Belizean (22.4%, a difference of 0.010%), Liberian (22.4%, a difference of 0.060%), Immigrants from Caribbean (22.4%, a difference of 0.11%), Immigrants from Bahamas (22.5%, a difference of 0.26%), and Immigrants from West Indies (22.5%, a difference of 0.40%).
| Demographics | Rating | Rank | Single Female Poverty |
| French | 2.3 /100 | #240 | Tragic 22.2% |
| Cape Verdeans | 2.1 /100 | #241 | Tragic 22.3% |
| Bermudans | 2.0 /100 | #242 | Tragic 22.3% |
| West Indians | 1.9 /100 | #243 | Tragic 22.3% |
| Immigrants | Middle Africa | 1.9 /100 | #244 | Tragic 22.3% |
| Immigrants | Bangladesh | 1.8 /100 | #245 | Tragic 22.3% |
| Liberians | 1.4 /100 | #246 | Tragic 22.4% |
| Immigrants | El Salvador | 1.4 /100 | #247 | Tragic 22.4% |
| Belizeans | 1.4 /100 | #248 | Tragic 22.4% |
| Immigrants | Caribbean | 1.3 /100 | #249 | Tragic 22.4% |
| Immigrants | Bahamas | 1.2 /100 | #250 | Tragic 22.5% |
| Immigrants | West Indies | 1.0 /100 | #251 | Tragic 22.5% |
| Delaware | 1.0 /100 | #252 | Tragic 22.5% |
| Immigrants | Liberia | 0.9 /100 | #253 | Tragic 22.5% |
| Immigrants | Burma/Myanmar | 0.8 /100 | #254 | Tragic 22.6% |