Osage vs Brazilian Single Female Poverty
COMPARE
Osage
Brazilian
Single Female Poverty
Single Female Poverty Comparison
Osage
Brazilians
24.4%
SINGLE FEMALE POVERTY
0.0/ 100
METRIC RATING
291st/ 347
METRIC RANK
20.1%
SINGLE FEMALE POVERTY
94.4/ 100
METRIC RATING
123rd/ 347
METRIC RANK
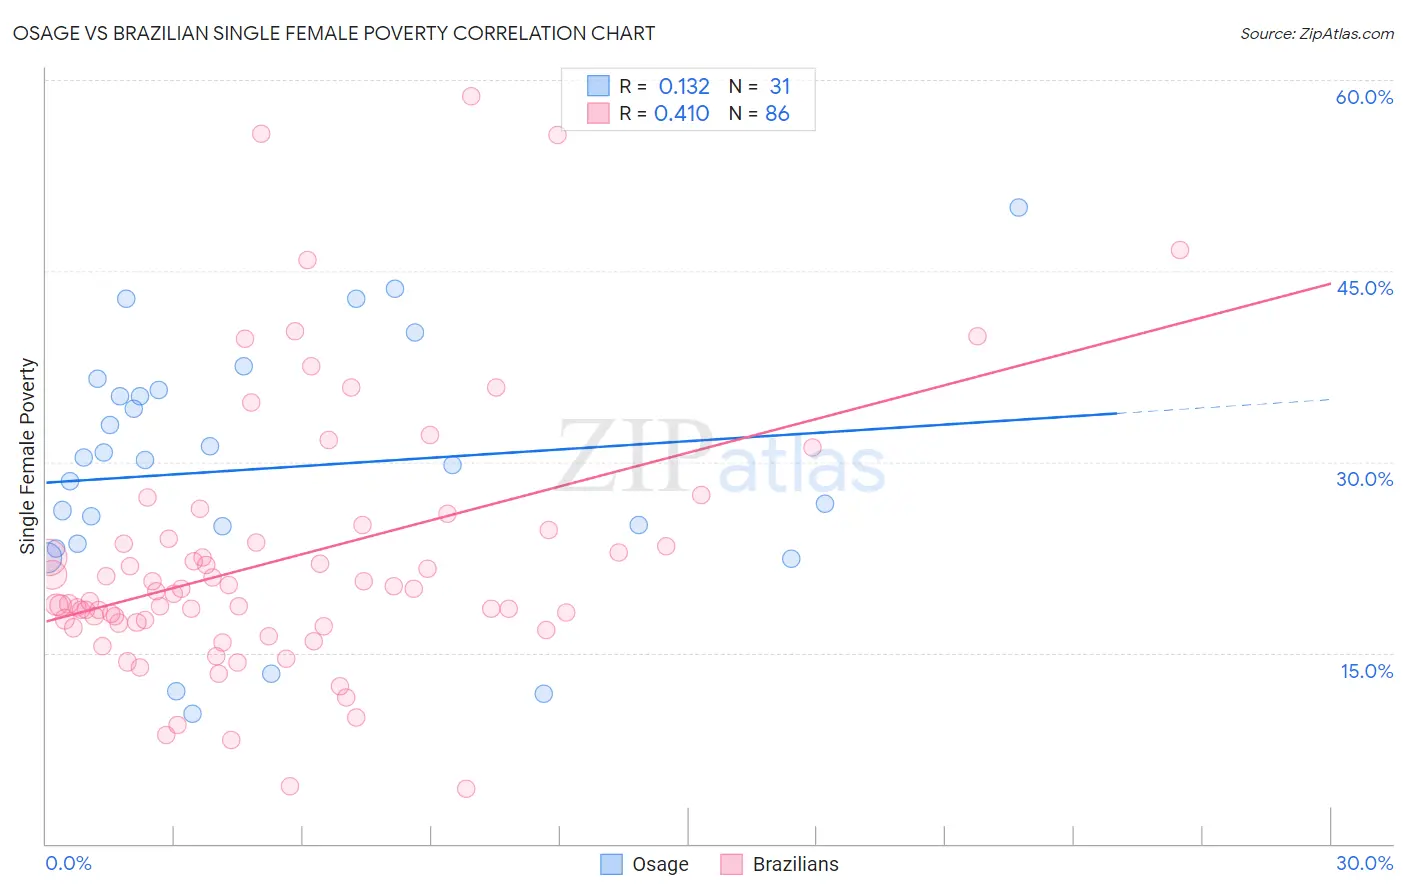
Osage vs Brazilian Single Female Poverty Correlation Chart
The statistical analysis conducted on geographies consisting of 91,495,293 people shows a poor positive correlation between the proportion of Osage and poverty level among single females in the United States with a correlation coefficient (R) of 0.132 and weighted average of 24.4%. Similarly, the statistical analysis conducted on geographies consisting of 319,523,574 people shows a moderate positive correlation between the proportion of Brazilians and poverty level among single females in the United States with a correlation coefficient (R) of 0.410 and weighted average of 20.1%, a difference of 21.5%.
Single Female Poverty Correlation Summary
| Measurement | Osage | Brazilian |
| Minimum | 10.2% | 4.3% |
| Maximum | 50.0% | 58.7% |
| Range | 39.8% | 54.4% |
| Mean | 29.5% | 22.4% |
| Median | 30.1% | 19.7% |
| Interquartile 25% (IQ1) | 23.6% | 17.3% |
| Interquartile 75% (IQ3) | 35.7% | 23.9% |
| Interquartile Range (IQR) | 12.1% | 6.6% |
| Standard Deviation (Sample) | 9.7% | 10.5% |
| Standard Deviation (Population) | 9.6% | 10.4% |
Similar Demographics by Single Female Poverty
Demographics Similar to Osage by Single Female Poverty
In terms of single female poverty, the demographic groups most similar to Osage are Alsatian (24.5%, a difference of 0.37%), American (24.5%, a difference of 0.44%), French American Indian (24.6%, a difference of 0.59%), Indonesian (24.3%, a difference of 0.60%), and U.S. Virgin Islander (24.2%, a difference of 0.94%).
| Demographics | Rating | Rank | Single Female Poverty |
| Immigrants | Dominica | 0.0 /100 | #284 | Tragic 23.9% |
| Immigrants | Guatemala | 0.0 /100 | #285 | Tragic 24.1% |
| Cree | 0.0 /100 | #286 | Tragic 24.1% |
| Bangladeshis | 0.0 /100 | #287 | Tragic 24.2% |
| Spanish Americans | 0.0 /100 | #288 | Tragic 24.2% |
| U.S. Virgin Islanders | 0.0 /100 | #289 | Tragic 24.2% |
| Indonesians | 0.0 /100 | #290 | Tragic 24.3% |
| Osage | 0.0 /100 | #291 | Tragic 24.4% |
| Alsatians | 0.0 /100 | #292 | Tragic 24.5% |
| Americans | 0.0 /100 | #293 | Tragic 24.5% |
| French American Indians | 0.0 /100 | #294 | Tragic 24.6% |
| Hispanics or Latinos | 0.0 /100 | #295 | Tragic 24.6% |
| Africans | 0.0 /100 | #296 | Tragic 24.8% |
| Immigrants | Central America | 0.0 /100 | #297 | Tragic 24.8% |
| Yaqui | 0.0 /100 | #298 | Tragic 24.9% |
Demographics Similar to Brazilians by Single Female Poverty
In terms of single female poverty, the demographic groups most similar to Brazilians are Immigrants from Chile (20.1%, a difference of 0.030%), Immigrants from South Africa (20.1%, a difference of 0.15%), Immigrants from South America (20.0%, a difference of 0.18%), Immigrants from Switzerland (20.0%, a difference of 0.21%), and South American (20.0%, a difference of 0.24%).
| Demographics | Rating | Rank | Single Female Poverty |
| Immigrants | Kazakhstan | 95.7 /100 | #116 | Exceptional 20.0% |
| Poles | 95.6 /100 | #117 | Exceptional 20.0% |
| Immigrants | Afghanistan | 95.4 /100 | #118 | Exceptional 20.0% |
| Immigrants | Ethiopia | 95.4 /100 | #119 | Exceptional 20.0% |
| South Americans | 95.1 /100 | #120 | Exceptional 20.0% |
| Immigrants | Switzerland | 95.1 /100 | #121 | Exceptional 20.0% |
| Immigrants | South America | 95.0 /100 | #122 | Exceptional 20.0% |
| Brazilians | 94.4 /100 | #123 | Exceptional 20.1% |
| Immigrants | Chile | 94.3 /100 | #124 | Exceptional 20.1% |
| Immigrants | South Africa | 93.9 /100 | #125 | Exceptional 20.1% |
| Serbians | 93.3 /100 | #126 | Exceptional 20.1% |
| Mongolians | 93.2 /100 | #127 | Exceptional 20.2% |
| Immigrants | Spain | 92.7 /100 | #128 | Exceptional 20.2% |
| Immigrants | Morocco | 92.4 /100 | #129 | Exceptional 20.2% |
| Immigrants | Hungary | 92.3 /100 | #130 | Exceptional 20.2% |