Osage vs Immigrants from Singapore Single Female Poverty
COMPARE
Osage
Immigrants from Singapore
Single Female Poverty
Single Female Poverty Comparison
Osage
Immigrants from Singapore
24.4%
SINGLE FEMALE POVERTY
0.0/ 100
METRIC RATING
291st/ 347
METRIC RANK
18.3%
SINGLE FEMALE POVERTY
100.0/ 100
METRIC RATING
25th/ 347
METRIC RANK
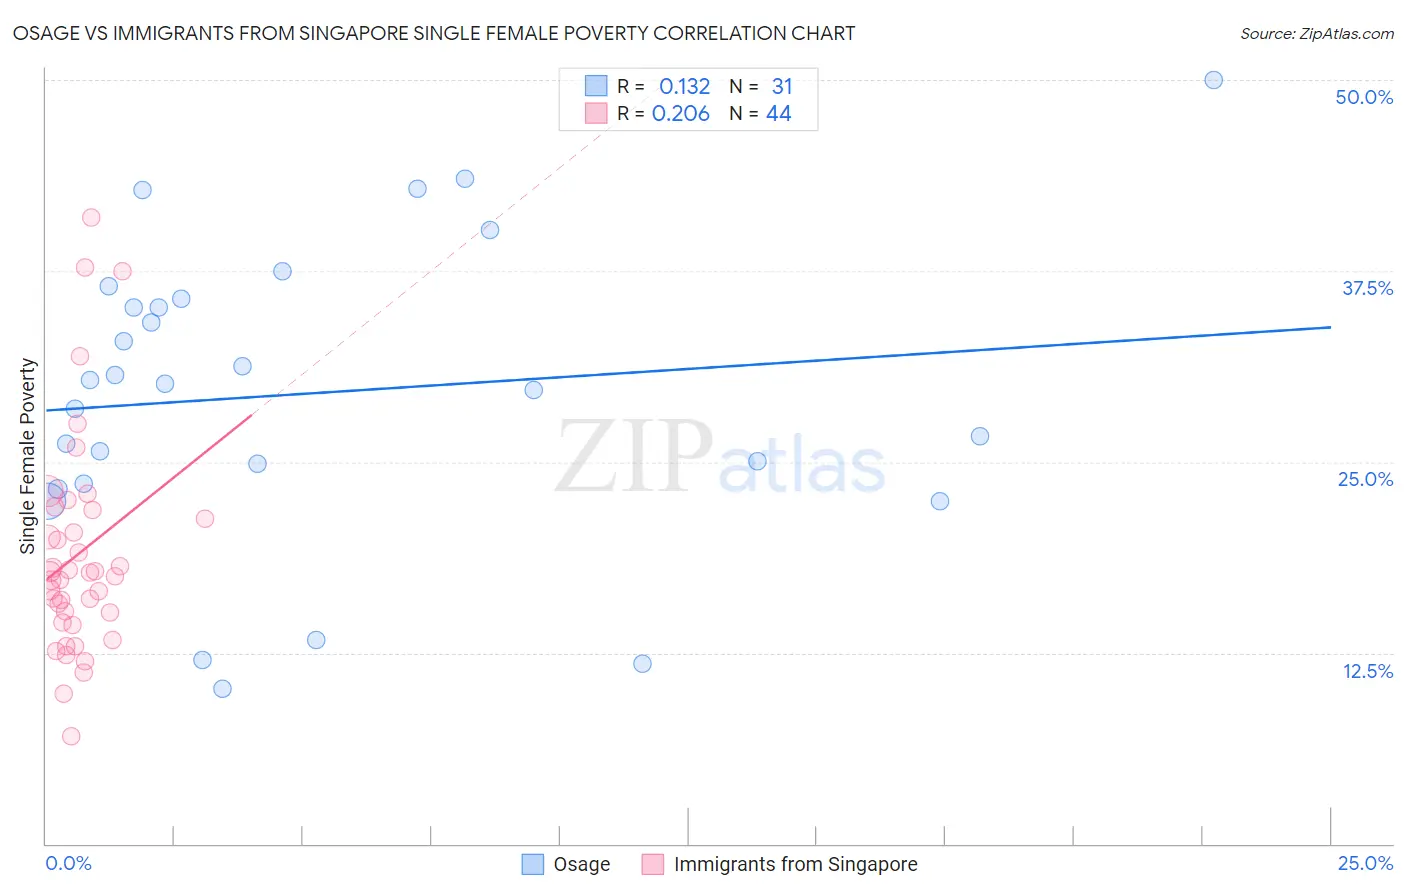
Osage vs Immigrants from Singapore Single Female Poverty Correlation Chart
The statistical analysis conducted on geographies consisting of 91,495,293 people shows a poor positive correlation between the proportion of Osage and poverty level among single females in the United States with a correlation coefficient (R) of 0.132 and weighted average of 24.4%. Similarly, the statistical analysis conducted on geographies consisting of 136,295,396 people shows a weak positive correlation between the proportion of Immigrants from Singapore and poverty level among single females in the United States with a correlation coefficient (R) of 0.206 and weighted average of 18.3%, a difference of 33.1%.
Single Female Poverty Correlation Summary
| Measurement | Osage | Immigrants from Singapore |
| Minimum | 10.2% | 7.1% |
| Maximum | 50.0% | 41.0% |
| Range | 39.8% | 33.9% |
| Mean | 29.5% | 19.0% |
| Median | 30.1% | 17.7% |
| Interquartile 25% (IQ1) | 23.6% | 14.8% |
| Interquartile 75% (IQ3) | 35.7% | 21.6% |
| Interquartile Range (IQR) | 12.1% | 6.8% |
| Standard Deviation (Sample) | 9.7% | 7.2% |
| Standard Deviation (Population) | 9.6% | 7.1% |
Similar Demographics by Single Female Poverty
Demographics Similar to Osage by Single Female Poverty
In terms of single female poverty, the demographic groups most similar to Osage are Alsatian (24.5%, a difference of 0.37%), American (24.5%, a difference of 0.44%), French American Indian (24.6%, a difference of 0.59%), Indonesian (24.3%, a difference of 0.60%), and U.S. Virgin Islander (24.2%, a difference of 0.94%).
| Demographics | Rating | Rank | Single Female Poverty |
| Immigrants | Dominica | 0.0 /100 | #284 | Tragic 23.9% |
| Immigrants | Guatemala | 0.0 /100 | #285 | Tragic 24.1% |
| Cree | 0.0 /100 | #286 | Tragic 24.1% |
| Bangladeshis | 0.0 /100 | #287 | Tragic 24.2% |
| Spanish Americans | 0.0 /100 | #288 | Tragic 24.2% |
| U.S. Virgin Islanders | 0.0 /100 | #289 | Tragic 24.2% |
| Indonesians | 0.0 /100 | #290 | Tragic 24.3% |
| Osage | 0.0 /100 | #291 | Tragic 24.4% |
| Alsatians | 0.0 /100 | #292 | Tragic 24.5% |
| Americans | 0.0 /100 | #293 | Tragic 24.5% |
| French American Indians | 0.0 /100 | #294 | Tragic 24.6% |
| Hispanics or Latinos | 0.0 /100 | #295 | Tragic 24.6% |
| Africans | 0.0 /100 | #296 | Tragic 24.8% |
| Immigrants | Central America | 0.0 /100 | #297 | Tragic 24.8% |
| Yaqui | 0.0 /100 | #298 | Tragic 24.9% |
Demographics Similar to Immigrants from Singapore by Single Female Poverty
In terms of single female poverty, the demographic groups most similar to Immigrants from Singapore are Immigrants from Israel (18.3%, a difference of 0.020%), Armenian (18.3%, a difference of 0.10%), Burmese (18.3%, a difference of 0.33%), Asian (18.3%, a difference of 0.33%), and Maltese (18.3%, a difference of 0.34%).
| Demographics | Rating | Rank | Single Female Poverty |
| Immigrants | Eastern Asia | 100.0 /100 | #18 | Exceptional 18.1% |
| Immigrants | China | 100.0 /100 | #19 | Exceptional 18.1% |
| Immigrants | Greece | 100.0 /100 | #20 | Exceptional 18.3% |
| Maltese | 100.0 /100 | #21 | Exceptional 18.3% |
| Burmese | 100.0 /100 | #22 | Exceptional 18.3% |
| Asians | 100.0 /100 | #23 | Exceptional 18.3% |
| Armenians | 100.0 /100 | #24 | Exceptional 18.3% |
| Immigrants | Singapore | 100.0 /100 | #25 | Exceptional 18.3% |
| Immigrants | Israel | 100.0 /100 | #26 | Exceptional 18.3% |
| Immigrants | Pakistan | 100.0 /100 | #27 | Exceptional 18.4% |
| Immigrants | Moldova | 100.0 /100 | #28 | Exceptional 18.5% |
| Immigrants | Poland | 100.0 /100 | #29 | Exceptional 18.5% |
| Immigrants | North Macedonia | 99.9 /100 | #30 | Exceptional 18.5% |
| Immigrants | Asia | 99.9 /100 | #31 | Exceptional 18.6% |
| Immigrants | Sri Lanka | 99.9 /100 | #32 | Exceptional 18.6% |