Osage vs Immigrants from Western Asia Single Female Poverty
COMPARE
Osage
Immigrants from Western Asia
Single Female Poverty
Single Female Poverty Comparison
Osage
Immigrants from Western Asia
24.4%
SINGLE FEMALE POVERTY
0.0/ 100
METRIC RATING
291st/ 347
METRIC RANK
19.9%
SINGLE FEMALE POVERTY
96.5/ 100
METRIC RATING
110th/ 347
METRIC RANK
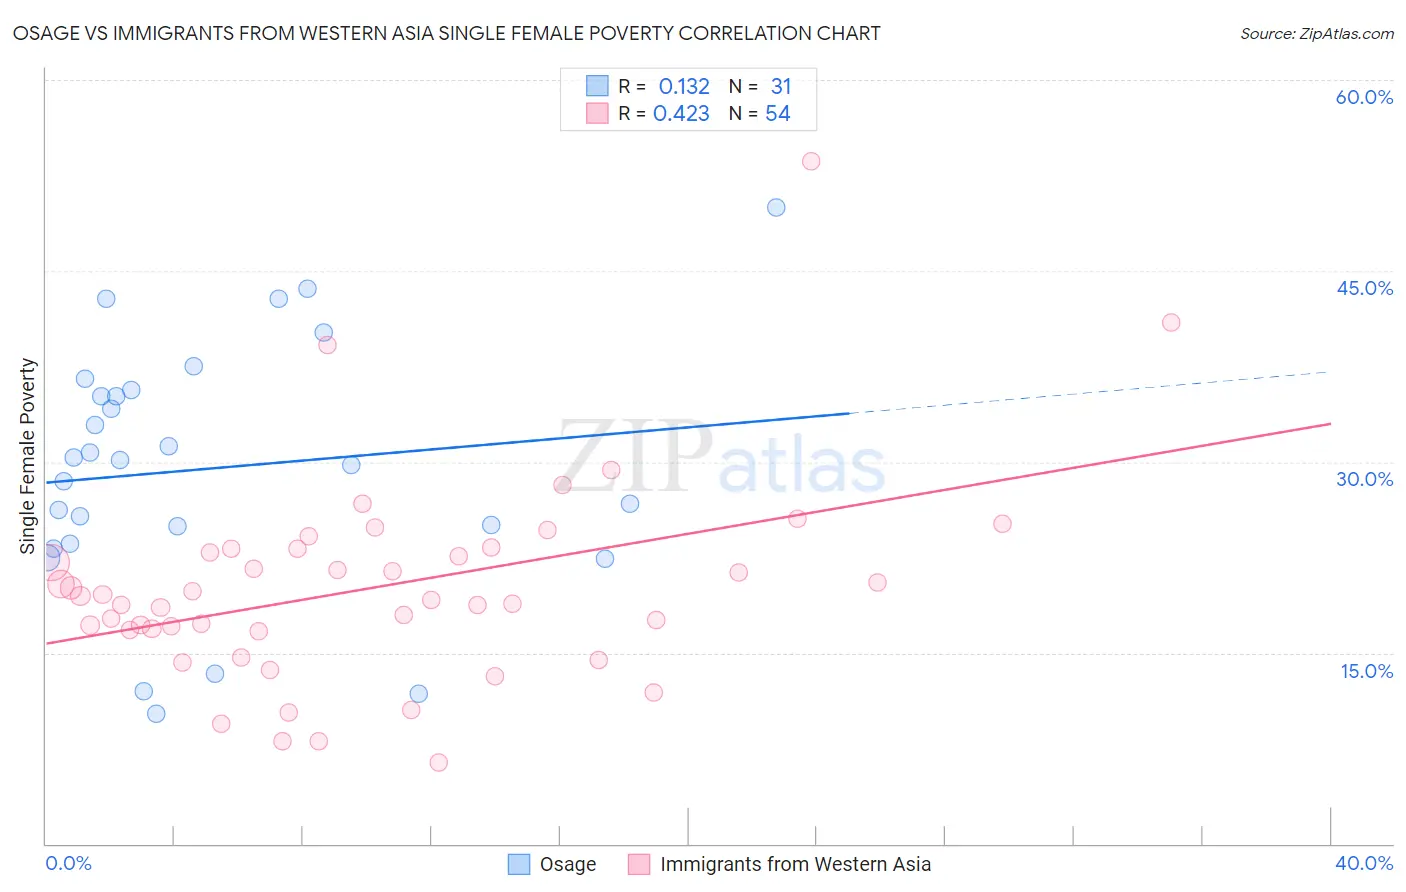
Osage vs Immigrants from Western Asia Single Female Poverty Correlation Chart
The statistical analysis conducted on geographies consisting of 91,495,293 people shows a poor positive correlation between the proportion of Osage and poverty level among single females in the United States with a correlation coefficient (R) of 0.132 and weighted average of 24.4%. Similarly, the statistical analysis conducted on geographies consisting of 397,084,795 people shows a moderate positive correlation between the proportion of Immigrants from Western Asia and poverty level among single females in the United States with a correlation coefficient (R) of 0.423 and weighted average of 19.9%, a difference of 22.5%.
Single Female Poverty Correlation Summary
| Measurement | Osage | Immigrants from Western Asia |
| Minimum | 10.2% | 6.4% |
| Maximum | 50.0% | 53.6% |
| Range | 39.8% | 47.2% |
| Mean | 29.5% | 20.1% |
| Median | 30.1% | 19.3% |
| Interquartile 25% (IQ1) | 23.6% | 16.8% |
| Interquartile 75% (IQ3) | 35.7% | 23.2% |
| Interquartile Range (IQR) | 12.1% | 6.4% |
| Standard Deviation (Sample) | 9.7% | 8.0% |
| Standard Deviation (Population) | 9.6% | 7.9% |
Similar Demographics by Single Female Poverty
Demographics Similar to Osage by Single Female Poverty
In terms of single female poverty, the demographic groups most similar to Osage are Alsatian (24.5%, a difference of 0.37%), American (24.5%, a difference of 0.44%), French American Indian (24.6%, a difference of 0.59%), Indonesian (24.3%, a difference of 0.60%), and U.S. Virgin Islander (24.2%, a difference of 0.94%).
| Demographics | Rating | Rank | Single Female Poverty |
| Immigrants | Dominica | 0.0 /100 | #284 | Tragic 23.9% |
| Immigrants | Guatemala | 0.0 /100 | #285 | Tragic 24.1% |
| Cree | 0.0 /100 | #286 | Tragic 24.1% |
| Bangladeshis | 0.0 /100 | #287 | Tragic 24.2% |
| Spanish Americans | 0.0 /100 | #288 | Tragic 24.2% |
| U.S. Virgin Islanders | 0.0 /100 | #289 | Tragic 24.2% |
| Indonesians | 0.0 /100 | #290 | Tragic 24.3% |
| Osage | 0.0 /100 | #291 | Tragic 24.4% |
| Alsatians | 0.0 /100 | #292 | Tragic 24.5% |
| Americans | 0.0 /100 | #293 | Tragic 24.5% |
| French American Indians | 0.0 /100 | #294 | Tragic 24.6% |
| Hispanics or Latinos | 0.0 /100 | #295 | Tragic 24.6% |
| Africans | 0.0 /100 | #296 | Tragic 24.8% |
| Immigrants | Central America | 0.0 /100 | #297 | Tragic 24.8% |
| Yaqui | 0.0 /100 | #298 | Tragic 24.9% |
Demographics Similar to Immigrants from Western Asia by Single Female Poverty
In terms of single female poverty, the demographic groups most similar to Immigrants from Western Asia are Colombian (19.9%, a difference of 0.010%), Native Hawaiian (19.9%, a difference of 0.020%), Immigrants from Syria (19.9%, a difference of 0.070%), Ethiopian (19.9%, a difference of 0.080%), and Israeli (19.9%, a difference of 0.18%).
| Demographics | Rating | Rank | Single Female Poverty |
| Immigrants | Southern Europe | 97.1 /100 | #103 | Exceptional 19.9% |
| Chileans | 96.9 /100 | #104 | Exceptional 19.9% |
| Israelis | 96.9 /100 | #105 | Exceptional 19.9% |
| Ethiopians | 96.7 /100 | #106 | Exceptional 19.9% |
| Immigrants | Syria | 96.7 /100 | #107 | Exceptional 19.9% |
| Native Hawaiians | 96.6 /100 | #108 | Exceptional 19.9% |
| Colombians | 96.6 /100 | #109 | Exceptional 19.9% |
| Immigrants | Western Asia | 96.5 /100 | #110 | Exceptional 19.9% |
| Carpatho Rusyns | 96.1 /100 | #111 | Exceptional 20.0% |
| Immigrants | Netherlands | 96.0 /100 | #112 | Exceptional 20.0% |
| Immigrants | Zimbabwe | 95.9 /100 | #113 | Exceptional 20.0% |
| Immigrants | Colombia | 95.9 /100 | #114 | Exceptional 20.0% |
| Immigrants | Northern Africa | 95.8 /100 | #115 | Exceptional 20.0% |
| Immigrants | Kazakhstan | 95.7 /100 | #116 | Exceptional 20.0% |
| Poles | 95.6 /100 | #117 | Exceptional 20.0% |