Osage vs Soviet Union Single Female Poverty
COMPARE
Osage
Soviet Union
Single Female Poverty
Single Female Poverty Comparison
Osage
Soviet Union
24.4%
SINGLE FEMALE POVERTY
0.0/ 100
METRIC RATING
291st/ 347
METRIC RANK
19.6%
SINGLE FEMALE POVERTY
98.8/ 100
METRIC RATING
91st/ 347
METRIC RANK
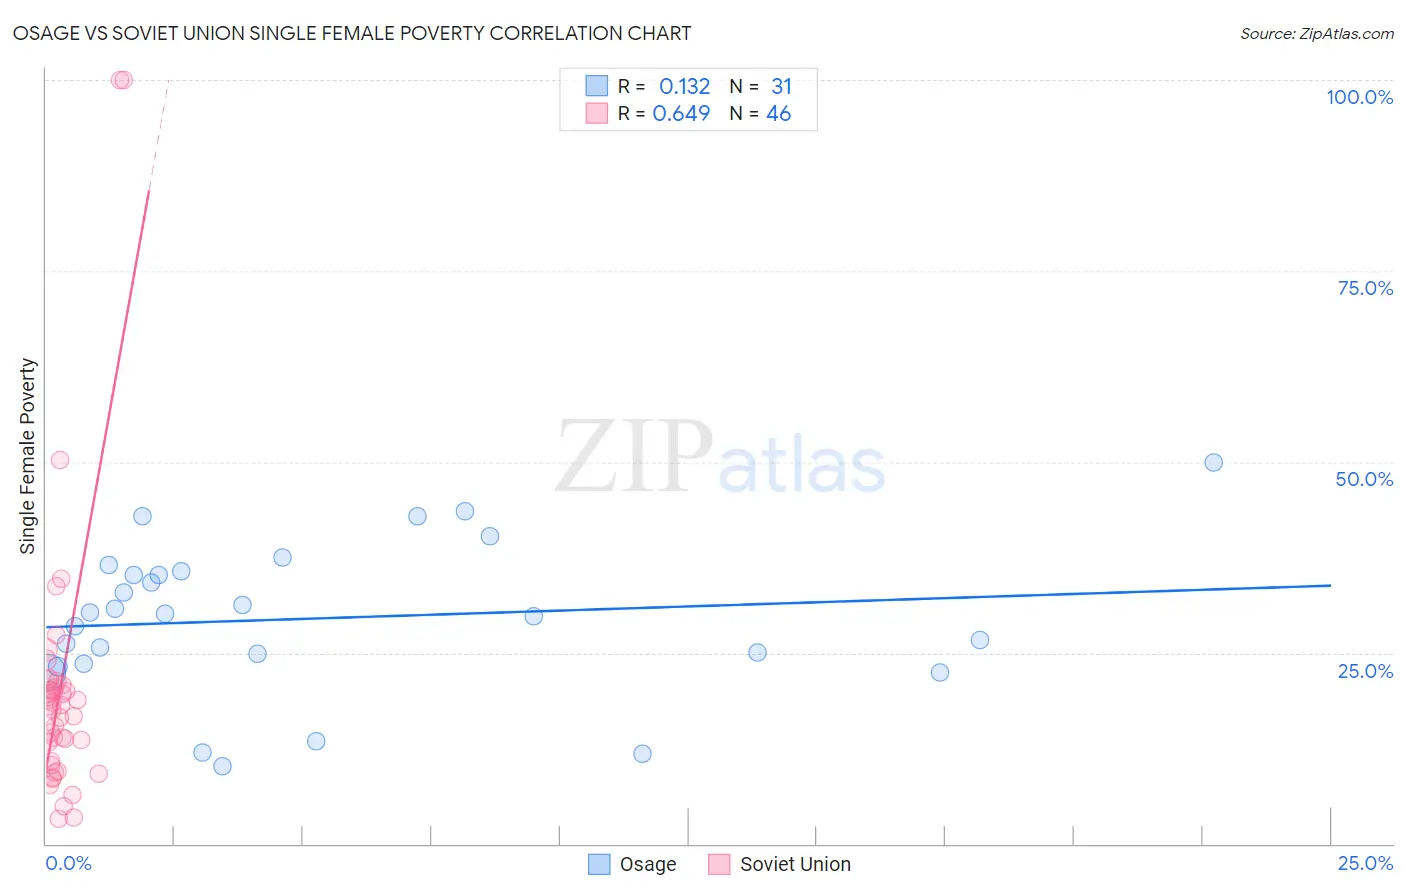
Osage vs Soviet Union Single Female Poverty Correlation Chart
The statistical analysis conducted on geographies consisting of 91,495,293 people shows a poor positive correlation between the proportion of Osage and poverty level among single females in the United States with a correlation coefficient (R) of 0.132 and weighted average of 24.4%. Similarly, the statistical analysis conducted on geographies consisting of 43,439,502 people shows a significant positive correlation between the proportion of Soviet Union and poverty level among single females in the United States with a correlation coefficient (R) of 0.649 and weighted average of 19.6%, a difference of 24.7%.
Single Female Poverty Correlation Summary
| Measurement | Osage | Soviet Union |
| Minimum | 10.2% | 3.3% |
| Maximum | 50.0% | 100.0% |
| Range | 39.8% | 96.7% |
| Mean | 29.5% | 20.7% |
| Median | 30.1% | 18.1% |
| Interquartile 25% (IQ1) | 23.6% | 10.8% |
| Interquartile 75% (IQ3) | 35.7% | 20.9% |
| Interquartile Range (IQR) | 12.1% | 10.0% |
| Standard Deviation (Sample) | 9.7% | 19.1% |
| Standard Deviation (Population) | 9.6% | 18.9% |
Similar Demographics by Single Female Poverty
Demographics Similar to Osage by Single Female Poverty
In terms of single female poverty, the demographic groups most similar to Osage are Alsatian (24.5%, a difference of 0.37%), American (24.5%, a difference of 0.44%), French American Indian (24.6%, a difference of 0.59%), Indonesian (24.3%, a difference of 0.60%), and U.S. Virgin Islander (24.2%, a difference of 0.94%).
| Demographics | Rating | Rank | Single Female Poverty |
| Immigrants | Dominica | 0.0 /100 | #284 | Tragic 23.9% |
| Immigrants | Guatemala | 0.0 /100 | #285 | Tragic 24.1% |
| Cree | 0.0 /100 | #286 | Tragic 24.1% |
| Bangladeshis | 0.0 /100 | #287 | Tragic 24.2% |
| Spanish Americans | 0.0 /100 | #288 | Tragic 24.2% |
| U.S. Virgin Islanders | 0.0 /100 | #289 | Tragic 24.2% |
| Indonesians | 0.0 /100 | #290 | Tragic 24.3% |
| Osage | 0.0 /100 | #291 | Tragic 24.4% |
| Alsatians | 0.0 /100 | #292 | Tragic 24.5% |
| Americans | 0.0 /100 | #293 | Tragic 24.5% |
| French American Indians | 0.0 /100 | #294 | Tragic 24.6% |
| Hispanics or Latinos | 0.0 /100 | #295 | Tragic 24.6% |
| Africans | 0.0 /100 | #296 | Tragic 24.8% |
| Immigrants | Central America | 0.0 /100 | #297 | Tragic 24.8% |
| Yaqui | 0.0 /100 | #298 | Tragic 24.9% |
Demographics Similar to Soviet Union by Single Female Poverty
In terms of single female poverty, the demographic groups most similar to Soviet Union are Italian (19.6%, a difference of 0.050%), Immigrants from Lebanon (19.6%, a difference of 0.060%), Immigrants from Austria (19.6%, a difference of 0.060%), Immigrants from Ukraine (19.5%, a difference of 0.24%), and Afghan (19.5%, a difference of 0.25%).
| Demographics | Rating | Rank | Single Female Poverty |
| Immigrants | Sweden | 99.2 /100 | #84 | Exceptional 19.4% |
| Immigrants | Albania | 99.2 /100 | #85 | Exceptional 19.4% |
| Greeks | 99.2 /100 | #86 | Exceptional 19.4% |
| Zimbabweans | 99.0 /100 | #87 | Exceptional 19.5% |
| Afghans | 99.0 /100 | #88 | Exceptional 19.5% |
| Immigrants | Ukraine | 99.0 /100 | #89 | Exceptional 19.5% |
| Immigrants | Lebanon | 98.8 /100 | #90 | Exceptional 19.6% |
| Soviet Union | 98.8 /100 | #91 | Exceptional 19.6% |
| Italians | 98.8 /100 | #92 | Exceptional 19.6% |
| Immigrants | Austria | 98.8 /100 | #93 | Exceptional 19.6% |
| Romanians | 98.6 /100 | #94 | Exceptional 19.6% |
| Estonians | 98.2 /100 | #95 | Exceptional 19.7% |
| Immigrants | Brazil | 98.2 /100 | #96 | Exceptional 19.7% |
| Croatians | 98.1 /100 | #97 | Exceptional 19.7% |
| Immigrants | France | 97.9 /100 | #98 | Exceptional 19.7% |