Lumbee vs Ottawa Cognitive Disability
COMPARE
Lumbee
Ottawa
Cognitive Disability
Cognitive Disability Comparison
Lumbee
Ottawa
19.1%
COGNITIVE DISABILITY
0.0/ 100
METRIC RATING
338th/ 347
METRIC RANK
18.2%
COGNITIVE DISABILITY
0.1/ 100
METRIC RATING
291st/ 347
METRIC RANK
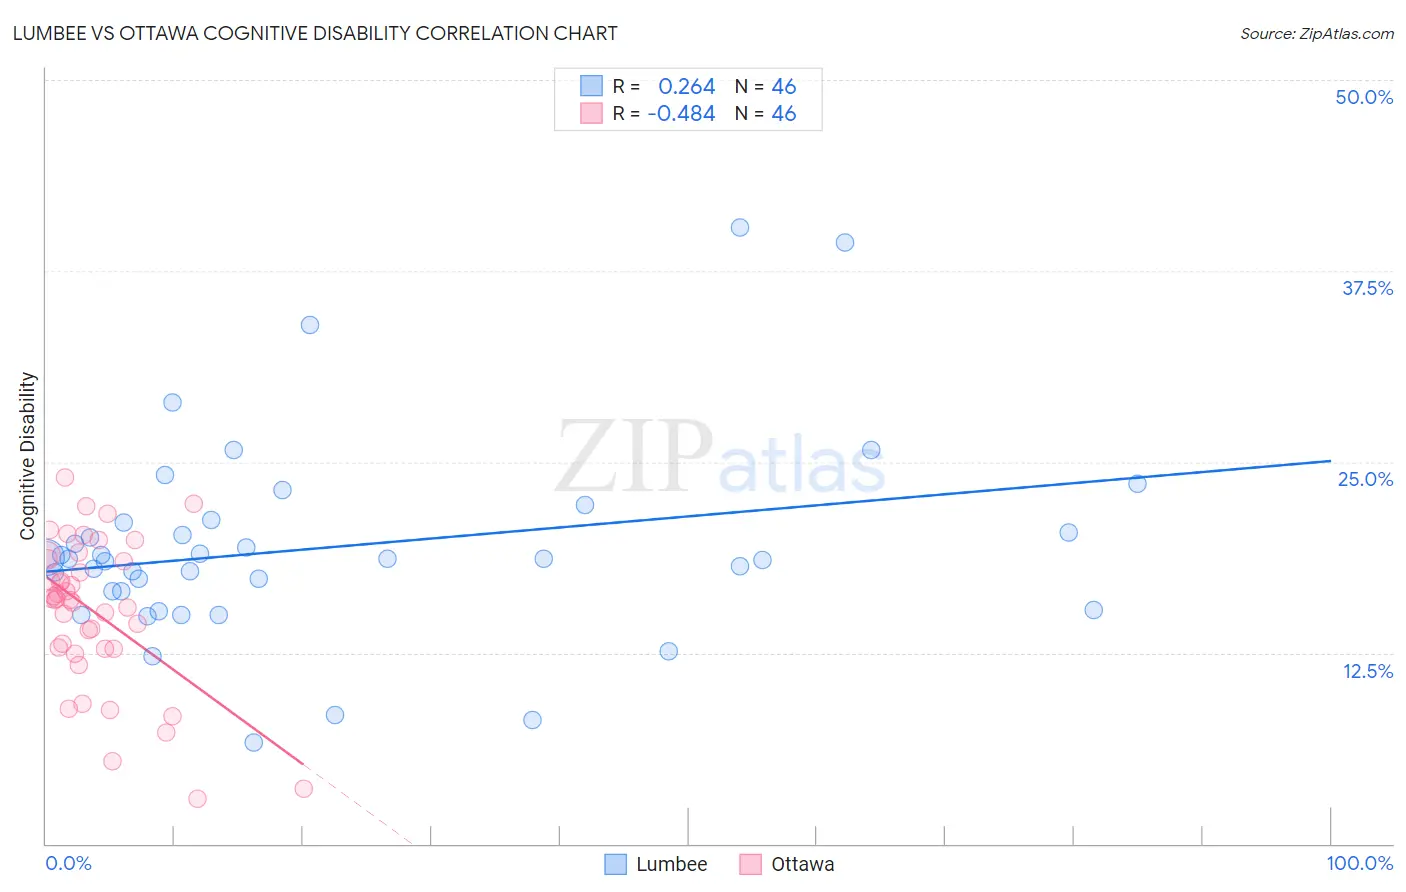
Lumbee vs Ottawa Cognitive Disability Correlation Chart
The statistical analysis conducted on geographies consisting of 92,289,773 people shows a weak positive correlation between the proportion of Lumbee and percentage of population with cognitive disability in the United States with a correlation coefficient (R) of 0.264 and weighted average of 19.1%. Similarly, the statistical analysis conducted on geographies consisting of 49,955,191 people shows a moderate negative correlation between the proportion of Ottawa and percentage of population with cognitive disability in the United States with a correlation coefficient (R) of -0.484 and weighted average of 18.2%, a difference of 5.2%.
Cognitive Disability Correlation Summary
| Measurement | Lumbee | Ottawa |
| Minimum | 6.6% | 2.9% |
| Maximum | 40.4% | 24.0% |
| Range | 33.7% | 21.0% |
| Mean | 19.4% | 15.2% |
| Median | 18.7% | 16.0% |
| Interquartile 25% (IQ1) | 16.5% | 12.8% |
| Interquartile 75% (IQ3) | 21.0% | 18.7% |
| Interquartile Range (IQR) | 4.5% | 5.9% |
| Standard Deviation (Sample) | 6.6% | 4.9% |
| Standard Deviation (Population) | 6.5% | 4.8% |
Similar Demographics by Cognitive Disability
Demographics Similar to Lumbee by Cognitive Disability
In terms of cognitive disability, the demographic groups most similar to Lumbee are Immigrants from Saudi Arabia (19.1%, a difference of 0.34%), Black/African American (19.0%, a difference of 0.47%), Puerto Rican (19.2%, a difference of 0.47%), Cape Verdean (19.2%, a difference of 0.50%), and Tohono O'odham (19.3%, a difference of 0.74%).
| Demographics | Rating | Rank | Cognitive Disability |
| Pima | 0.0 /100 | #331 | Tragic 18.8% |
| Immigrants | Sudan | 0.0 /100 | #332 | Tragic 18.8% |
| Immigrants | Yemen | 0.0 /100 | #333 | Tragic 18.8% |
| Sudanese | 0.0 /100 | #334 | Tragic 18.9% |
| Senegalese | 0.0 /100 | #335 | Tragic 19.0% |
| Blacks/African Americans | 0.0 /100 | #336 | Tragic 19.0% |
| Immigrants | Saudi Arabia | 0.0 /100 | #337 | Tragic 19.1% |
| Lumbee | 0.0 /100 | #338 | Tragic 19.1% |
| Puerto Ricans | 0.0 /100 | #339 | Tragic 19.2% |
| Cape Verdeans | 0.0 /100 | #340 | Tragic 19.2% |
| Tohono O'odham | 0.0 /100 | #341 | Tragic 19.3% |
| Houma | 0.0 /100 | #342 | Tragic 19.3% |
| Immigrants | Zaire | 0.0 /100 | #343 | Tragic 19.4% |
| Immigrants | Congo | 0.0 /100 | #344 | Tragic 19.7% |
| Somalis | 0.0 /100 | #345 | Tragic 19.8% |
Demographics Similar to Ottawa by Cognitive Disability
In terms of cognitive disability, the demographic groups most similar to Ottawa are Iroquois (18.2%, a difference of 0.070%), Central American Indian (18.2%, a difference of 0.080%), Immigrants from Africa (18.1%, a difference of 0.13%), British West Indian (18.2%, a difference of 0.15%), and Native/Alaskan (18.1%, a difference of 0.16%).
| Demographics | Rating | Rank | Cognitive Disability |
| Immigrants | Uganda | 0.1 /100 | #284 | Tragic 18.1% |
| Bermudans | 0.1 /100 | #285 | Tragic 18.1% |
| Kenyans | 0.1 /100 | #286 | Tragic 18.1% |
| Dutch West Indians | 0.1 /100 | #287 | Tragic 18.1% |
| Immigrants | West Indies | 0.1 /100 | #288 | Tragic 18.1% |
| Natives/Alaskans | 0.1 /100 | #289 | Tragic 18.1% |
| Immigrants | Africa | 0.1 /100 | #290 | Tragic 18.1% |
| Ottawa | 0.1 /100 | #291 | Tragic 18.2% |
| Iroquois | 0.1 /100 | #292 | Tragic 18.2% |
| Central American Indians | 0.1 /100 | #293 | Tragic 18.2% |
| British West Indians | 0.1 /100 | #294 | Tragic 18.2% |
| German Russians | 0.0 /100 | #295 | Tragic 18.2% |
| Immigrants | Burma/Myanmar | 0.0 /100 | #296 | Tragic 18.2% |
| Blackfeet | 0.0 /100 | #297 | Tragic 18.3% |
| Japanese | 0.0 /100 | #298 | Tragic 18.3% |