Immigrants from Sierra Leone vs Tohono O'odham Married-Couple Family Poverty
COMPARE
Immigrants from Sierra Leone
Tohono O'odham
Married-Couple Family Poverty
Married-Couple Family Poverty Comparison
Immigrants from Sierra Leone
Tohono O'odham
5.3%
MARRIED-COUPLE FAMILY POVERTY
39.3/ 100
METRIC RATING
180th/ 347
METRIC RANK
11.2%
MARRIED-COUPLE FAMILY POVERTY
0.0/ 100
METRIC RATING
342nd/ 347
METRIC RANK
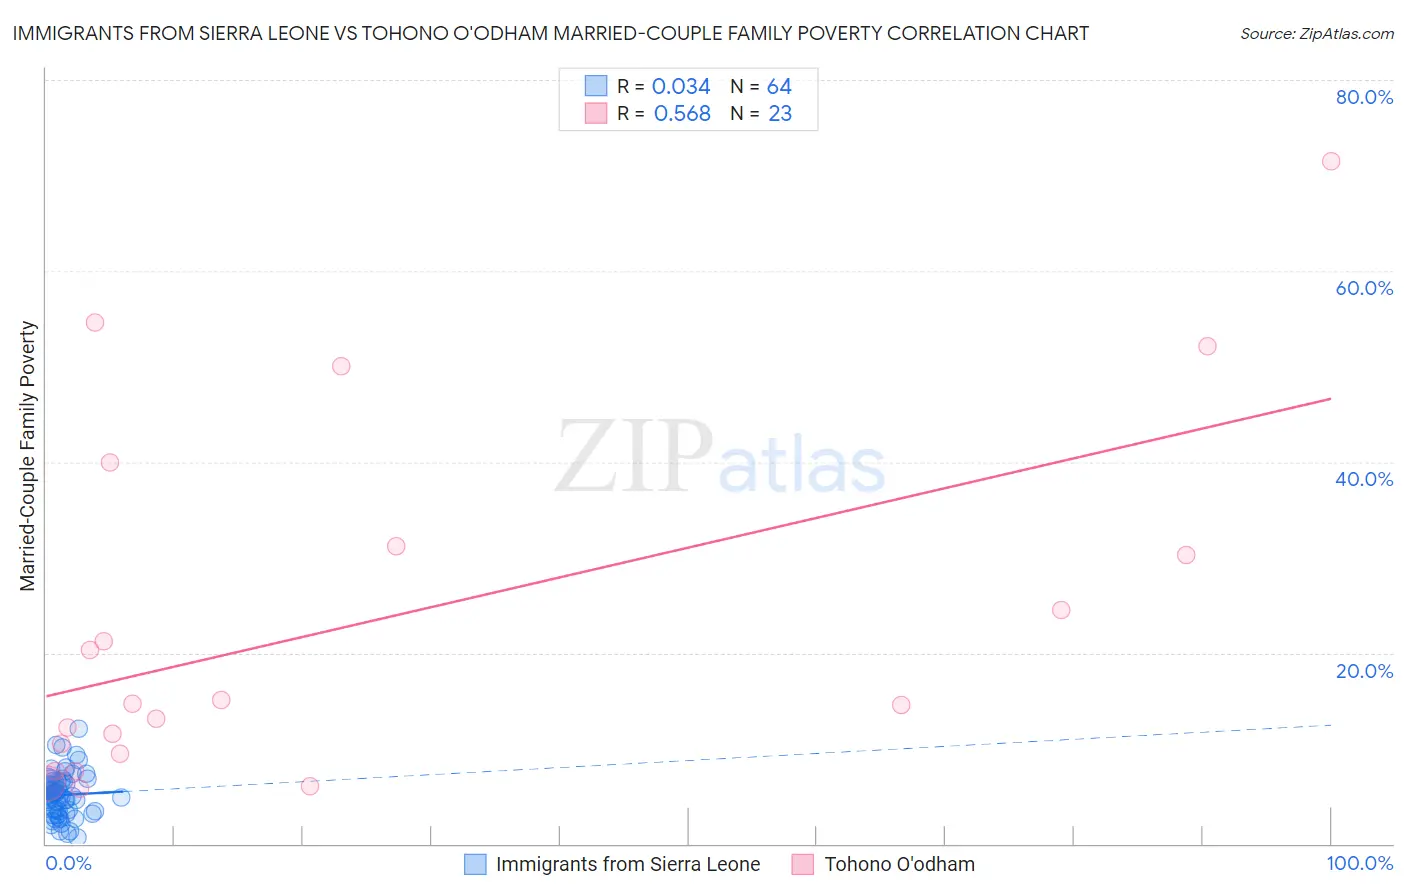
Immigrants from Sierra Leone vs Tohono O'odham Married-Couple Family Poverty Correlation Chart
The statistical analysis conducted on geographies consisting of 101,444,500 people shows no correlation between the proportion of Immigrants from Sierra Leone and poverty level among married-couple families in the United States with a correlation coefficient (R) of 0.034 and weighted average of 5.3%. Similarly, the statistical analysis conducted on geographies consisting of 58,693,710 people shows a substantial positive correlation between the proportion of Tohono O'odham and poverty level among married-couple families in the United States with a correlation coefficient (R) of 0.568 and weighted average of 11.2%, a difference of 112.3%.
Married-Couple Family Poverty Correlation Summary
| Measurement | Immigrants from Sierra Leone | Tohono O'odham |
| Minimum | 0.66% | 5.8% |
| Maximum | 12.0% | 71.6% |
| Range | 11.4% | 65.8% |
| Mean | 5.1% | 23.0% |
| Median | 5.1% | 14.7% |
| Interquartile 25% (IQ1) | 3.4% | 9.4% |
| Interquartile 75% (IQ3) | 6.4% | 31.2% |
| Interquartile Range (IQR) | 3.1% | 21.8% |
| Standard Deviation (Sample) | 2.3% | 18.6% |
| Standard Deviation (Population) | 2.3% | 18.2% |
Similar Demographics by Married-Couple Family Poverty
Demographics Similar to Immigrants from Sierra Leone by Married-Couple Family Poverty
In terms of married-couple family poverty, the demographic groups most similar to Immigrants from Sierra Leone are Immigrants from Chile (5.3%, a difference of 0.060%), Immigrants from Vietnam (5.3%, a difference of 0.18%), Peruvian (5.3%, a difference of 0.20%), Spanish (5.3%, a difference of 0.25%), and Nonimmigrants (5.3%, a difference of 0.42%).
| Demographics | Rating | Rank | Married-Couple Family Poverty |
| Alsatians | 51.2 /100 | #173 | Average 5.2% |
| Immigrants | Eastern Africa | 50.0 /100 | #174 | Average 5.2% |
| Marshallese | 47.9 /100 | #175 | Average 5.2% |
| Menominee | 47.8 /100 | #176 | Average 5.2% |
| Immigrants | Kazakhstan | 45.1 /100 | #177 | Average 5.2% |
| Immigrants | Ukraine | 44.9 /100 | #178 | Average 5.2% |
| Spanish | 41.4 /100 | #179 | Average 5.3% |
| Immigrants | Sierra Leone | 39.3 /100 | #180 | Fair 5.3% |
| Immigrants | Chile | 38.8 /100 | #181 | Fair 5.3% |
| Immigrants | Vietnam | 37.7 /100 | #182 | Fair 5.3% |
| Peruvians | 37.6 /100 | #183 | Fair 5.3% |
| Immigrants | Nonimmigrants | 35.8 /100 | #184 | Fair 5.3% |
| Americans | 35.4 /100 | #185 | Fair 5.3% |
| Hungarians | 34.7 /100 | #186 | Fair 5.3% |
| Immigrants | Albania | 33.8 /100 | #187 | Fair 5.3% |
Demographics Similar to Tohono O'odham by Married-Couple Family Poverty
In terms of married-couple family poverty, the demographic groups most similar to Tohono O'odham are Pueblo (11.1%, a difference of 0.93%), Pima (11.4%, a difference of 1.7%), Navajo (11.9%, a difference of 5.6%), Puerto Rican (12.6%, a difference of 12.6%), and Immigrants from Yemen (12.8%, a difference of 14.1%).
| Demographics | Rating | Rank | Married-Couple Family Poverty |
| Lumbee | 0.0 /100 | #333 | Tragic 8.3% |
| Immigrants | Dominican Republic | 0.0 /100 | #334 | Tragic 8.4% |
| Sioux | 0.0 /100 | #335 | Tragic 8.7% |
| Apache | 0.0 /100 | #336 | Tragic 9.0% |
| Yakama | 0.0 /100 | #337 | Tragic 9.0% |
| Cheyenne | 0.0 /100 | #338 | Tragic 9.4% |
| Crow | 0.0 /100 | #339 | Tragic 9.6% |
| Yuman | 0.0 /100 | #340 | Tragic 9.7% |
| Pueblo | 0.0 /100 | #341 | Tragic 11.1% |
| Tohono O'odham | 0.0 /100 | #342 | Tragic 11.2% |
| Pima | 0.0 /100 | #343 | Tragic 11.4% |
| Navajo | 0.0 /100 | #344 | Tragic 11.9% |
| Puerto Ricans | 0.0 /100 | #345 | Tragic 12.6% |
| Immigrants | Yemen | 0.0 /100 | #346 | Tragic 12.8% |
| Yup'ik | 0.0 /100 | #347 | Tragic 13.4% |