Immigrants from Sierra Leone vs Hawaiian Married-Couple Family Poverty
COMPARE
Immigrants from Sierra Leone
Hawaiian
Married-Couple Family Poverty
Married-Couple Family Poverty Comparison
Immigrants from Sierra Leone
Hawaiians
5.3%
MARRIED-COUPLE FAMILY POVERTY
39.3/ 100
METRIC RATING
180th/ 347
METRIC RANK
5.1%
MARRIED-COUPLE FAMILY POVERTY
62.3/ 100
METRIC RATING
164th/ 347
METRIC RANK
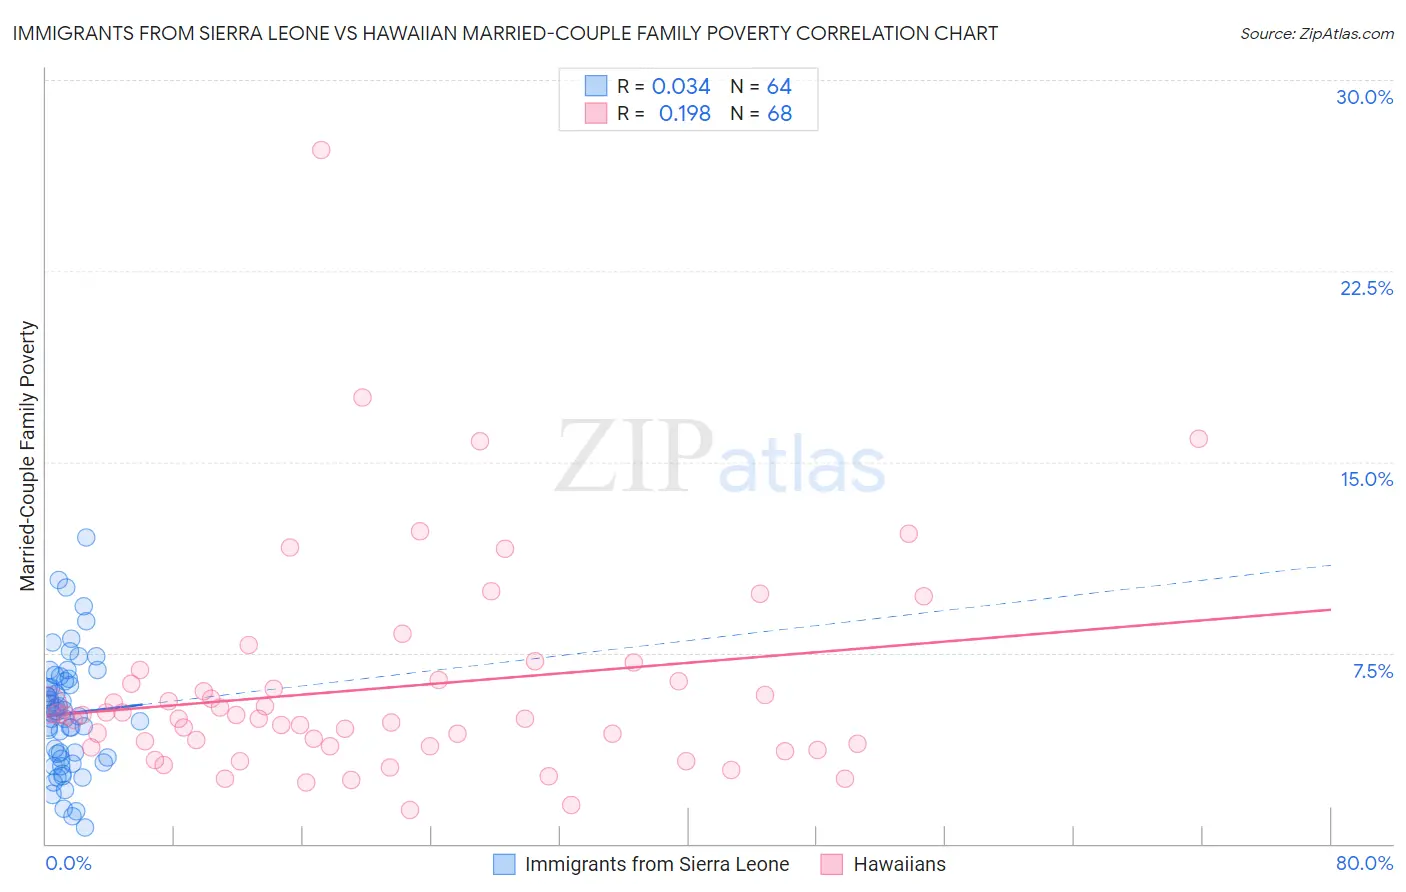
Immigrants from Sierra Leone vs Hawaiian Married-Couple Family Poverty Correlation Chart
The statistical analysis conducted on geographies consisting of 101,444,500 people shows no correlation between the proportion of Immigrants from Sierra Leone and poverty level among married-couple families in the United States with a correlation coefficient (R) of 0.034 and weighted average of 5.3%. Similarly, the statistical analysis conducted on geographies consisting of 325,605,449 people shows a poor positive correlation between the proportion of Hawaiians and poverty level among married-couple families in the United States with a correlation coefficient (R) of 0.198 and weighted average of 5.1%, a difference of 2.8%.
Married-Couple Family Poverty Correlation Summary
| Measurement | Immigrants from Sierra Leone | Hawaiian |
| Minimum | 0.66% | 1.3% |
| Maximum | 12.0% | 27.3% |
| Range | 11.4% | 26.0% |
| Mean | 5.1% | 6.1% |
| Median | 5.1% | 5.0% |
| Interquartile 25% (IQ1) | 3.4% | 3.8% |
| Interquartile 75% (IQ3) | 6.4% | 6.4% |
| Interquartile Range (IQR) | 3.1% | 2.6% |
| Standard Deviation (Sample) | 2.3% | 4.2% |
| Standard Deviation (Population) | 2.3% | 4.2% |
Demographics Similar to Immigrants from Sierra Leone and Hawaiians by Married-Couple Family Poverty
In terms of married-couple family poverty, the demographic groups most similar to Immigrants from Sierra Leone are Immigrants from Chile (5.3%, a difference of 0.060%), Immigrants from Vietnam (5.3%, a difference of 0.18%), Spanish (5.3%, a difference of 0.25%), Immigrants from Ukraine (5.2%, a difference of 0.67%), and Immigrants from Kazakhstan (5.2%, a difference of 0.69%). Similarly, the demographic groups most similar to Hawaiians are Immigrants from Malaysia (5.1%, a difference of 0.010%), Paraguayan (5.1%, a difference of 0.10%), Costa Rican (5.1%, a difference of 0.10%), Sierra Leonean (5.1%, a difference of 0.24%), and Immigrants from Jordan (5.1%, a difference of 0.55%).
| Demographics | Rating | Rank | Married-Couple Family Poverty |
| Immigrants | Jordan | 66.5 /100 | #162 | Good 5.1% |
| Sierra Leoneans | 64.1 /100 | #163 | Good 5.1% |
| Hawaiians | 62.3 /100 | #164 | Good 5.1% |
| Immigrants | Malaysia | 62.2 /100 | #165 | Good 5.1% |
| Paraguayans | 61.5 /100 | #166 | Good 5.1% |
| Costa Ricans | 61.5 /100 | #167 | Good 5.1% |
| Immigrants | Uganda | 54.9 /100 | #168 | Average 5.2% |
| Ottawa | 54.5 /100 | #169 | Average 5.2% |
| Immigrants | Argentina | 54.4 /100 | #170 | Average 5.2% |
| Bermudans | 52.9 /100 | #171 | Average 5.2% |
| Immigrants | Northern Africa | 51.3 /100 | #172 | Average 5.2% |
| Alsatians | 51.2 /100 | #173 | Average 5.2% |
| Immigrants | Eastern Africa | 50.0 /100 | #174 | Average 5.2% |
| Marshallese | 47.9 /100 | #175 | Average 5.2% |
| Menominee | 47.8 /100 | #176 | Average 5.2% |
| Immigrants | Kazakhstan | 45.1 /100 | #177 | Average 5.2% |
| Immigrants | Ukraine | 44.9 /100 | #178 | Average 5.2% |
| Spanish | 41.4 /100 | #179 | Average 5.3% |
| Immigrants | Sierra Leone | 39.3 /100 | #180 | Fair 5.3% |
| Immigrants | Chile | 38.8 /100 | #181 | Fair 5.3% |
| Immigrants | Vietnam | 37.7 /100 | #182 | Fair 5.3% |