Immigrants from Sierra Leone vs Belizean Married-Couple Family Poverty
COMPARE
Immigrants from Sierra Leone
Belizean
Married-Couple Family Poverty
Married-Couple Family Poverty Comparison
Immigrants from Sierra Leone
Belizeans
5.3%
MARRIED-COUPLE FAMILY POVERTY
39.3/ 100
METRIC RATING
180th/ 347
METRIC RANK
6.5%
MARRIED-COUPLE FAMILY POVERTY
0.0/ 100
METRIC RATING
291st/ 347
METRIC RANK
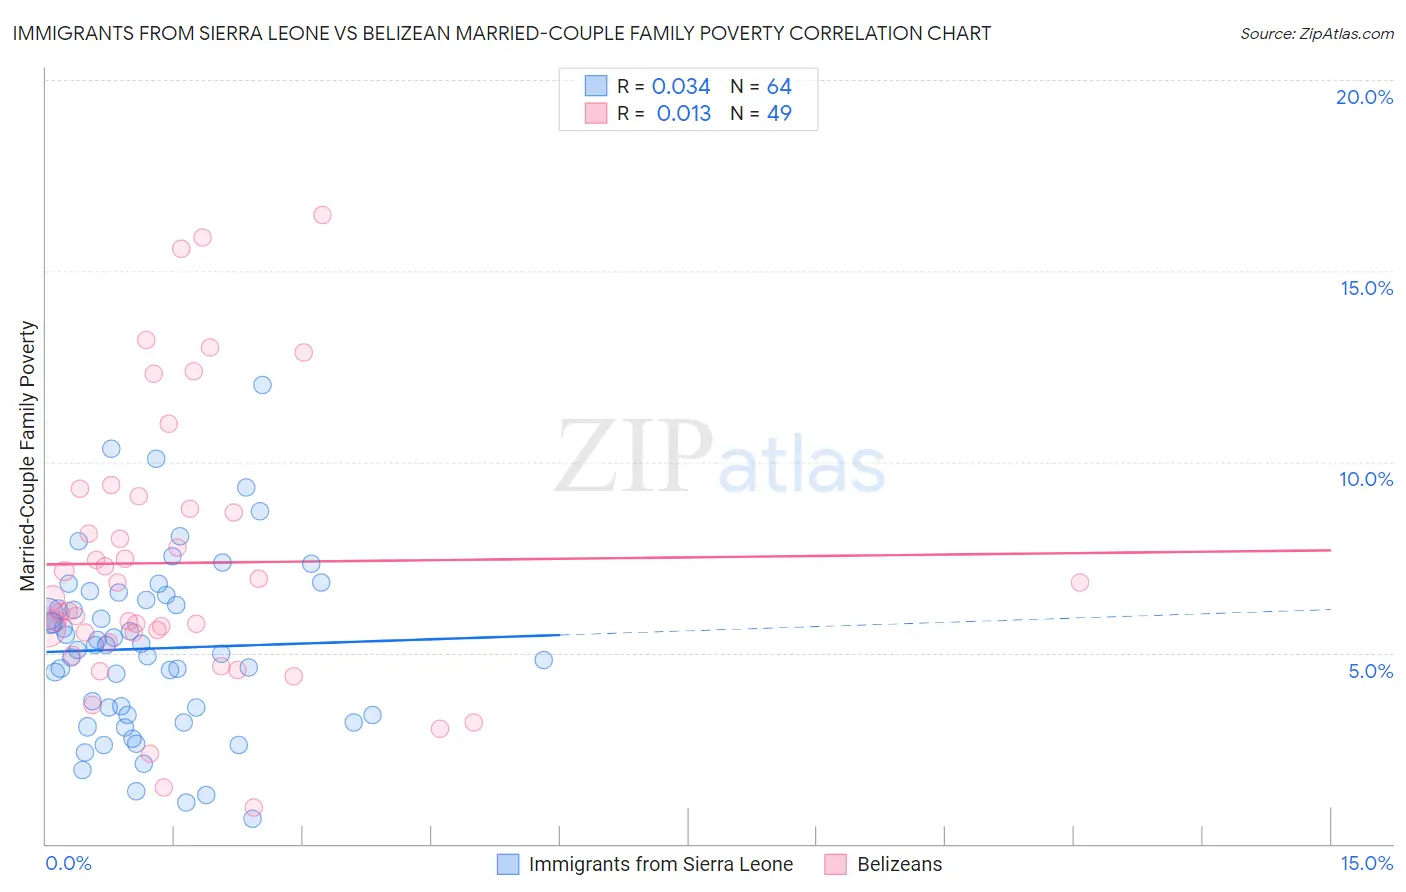
Immigrants from Sierra Leone vs Belizean Married-Couple Family Poverty Correlation Chart
The statistical analysis conducted on geographies consisting of 101,444,500 people shows no correlation between the proportion of Immigrants from Sierra Leone and poverty level among married-couple families in the United States with a correlation coefficient (R) of 0.034 and weighted average of 5.3%. Similarly, the statistical analysis conducted on geographies consisting of 143,932,988 people shows no correlation between the proportion of Belizeans and poverty level among married-couple families in the United States with a correlation coefficient (R) of 0.013 and weighted average of 6.5%, a difference of 23.9%.
Married-Couple Family Poverty Correlation Summary
| Measurement | Immigrants from Sierra Leone | Belizean |
| Minimum | 0.66% | 0.96% |
| Maximum | 12.0% | 16.5% |
| Range | 11.4% | 15.5% |
| Mean | 5.1% | 7.4% |
| Median | 5.1% | 6.5% |
| Interquartile 25% (IQ1) | 3.4% | 5.4% |
| Interquartile 75% (IQ3) | 6.4% | 8.9% |
| Interquartile Range (IQR) | 3.1% | 3.5% |
| Standard Deviation (Sample) | 2.3% | 3.6% |
| Standard Deviation (Population) | 2.3% | 3.6% |
Similar Demographics by Married-Couple Family Poverty
Demographics Similar to Immigrants from Sierra Leone by Married-Couple Family Poverty
In terms of married-couple family poverty, the demographic groups most similar to Immigrants from Sierra Leone are Immigrants from Chile (5.3%, a difference of 0.060%), Immigrants from Vietnam (5.3%, a difference of 0.18%), Peruvian (5.3%, a difference of 0.20%), Spanish (5.3%, a difference of 0.25%), and Nonimmigrants (5.3%, a difference of 0.42%).
| Demographics | Rating | Rank | Married-Couple Family Poverty |
| Alsatians | 51.2 /100 | #173 | Average 5.2% |
| Immigrants | Eastern Africa | 50.0 /100 | #174 | Average 5.2% |
| Marshallese | 47.9 /100 | #175 | Average 5.2% |
| Menominee | 47.8 /100 | #176 | Average 5.2% |
| Immigrants | Kazakhstan | 45.1 /100 | #177 | Average 5.2% |
| Immigrants | Ukraine | 44.9 /100 | #178 | Average 5.2% |
| Spanish | 41.4 /100 | #179 | Average 5.3% |
| Immigrants | Sierra Leone | 39.3 /100 | #180 | Fair 5.3% |
| Immigrants | Chile | 38.8 /100 | #181 | Fair 5.3% |
| Immigrants | Vietnam | 37.7 /100 | #182 | Fair 5.3% |
| Peruvians | 37.6 /100 | #183 | Fair 5.3% |
| Immigrants | Nonimmigrants | 35.8 /100 | #184 | Fair 5.3% |
| Americans | 35.4 /100 | #185 | Fair 5.3% |
| Hungarians | 34.7 /100 | #186 | Fair 5.3% |
| Immigrants | Albania | 33.8 /100 | #187 | Fair 5.3% |
Demographics Similar to Belizeans by Married-Couple Family Poverty
In terms of married-couple family poverty, the demographic groups most similar to Belizeans are Immigrants from Barbados (6.5%, a difference of 0.040%), Immigrants from Lebanon (6.6%, a difference of 0.17%), Nepalese (6.5%, a difference of 0.26%), Arapaho (6.6%, a difference of 0.26%), and Salvadoran (6.5%, a difference of 0.44%).
| Demographics | Rating | Rank | Married-Couple Family Poverty |
| Dutch West Indians | 0.0 /100 | #284 | Tragic 6.4% |
| Blacks/African Americans | 0.0 /100 | #285 | Tragic 6.5% |
| Guyanese | 0.0 /100 | #286 | Tragic 6.5% |
| Ecuadorians | 0.0 /100 | #287 | Tragic 6.5% |
| Salvadorans | 0.0 /100 | #288 | Tragic 6.5% |
| Nepalese | 0.0 /100 | #289 | Tragic 6.5% |
| Immigrants | Barbados | 0.0 /100 | #290 | Tragic 6.5% |
| Belizeans | 0.0 /100 | #291 | Tragic 6.5% |
| Immigrants | Lebanon | 0.0 /100 | #292 | Tragic 6.6% |
| Arapaho | 0.0 /100 | #293 | Tragic 6.6% |
| Bahamians | 0.0 /100 | #294 | Tragic 6.6% |
| Immigrants | Uzbekistan | 0.0 /100 | #295 | Tragic 6.6% |
| U.S. Virgin Islanders | 0.0 /100 | #296 | Tragic 6.6% |
| Kiowa | 0.0 /100 | #297 | Tragic 6.6% |
| Immigrants | Guyana | 0.0 /100 | #298 | Tragic 6.7% |