Immigrants from Sierra Leone vs Northern European Married-Couple Family Poverty
COMPARE
Immigrants from Sierra Leone
Northern European
Married-Couple Family Poverty
Married-Couple Family Poverty Comparison
Immigrants from Sierra Leone
Northern Europeans
5.3%
MARRIED-COUPLE FAMILY POVERTY
39.3/ 100
METRIC RATING
180th/ 347
METRIC RANK
4.3%
MARRIED-COUPLE FAMILY POVERTY
99.8/ 100
METRIC RATING
41st/ 347
METRIC RANK
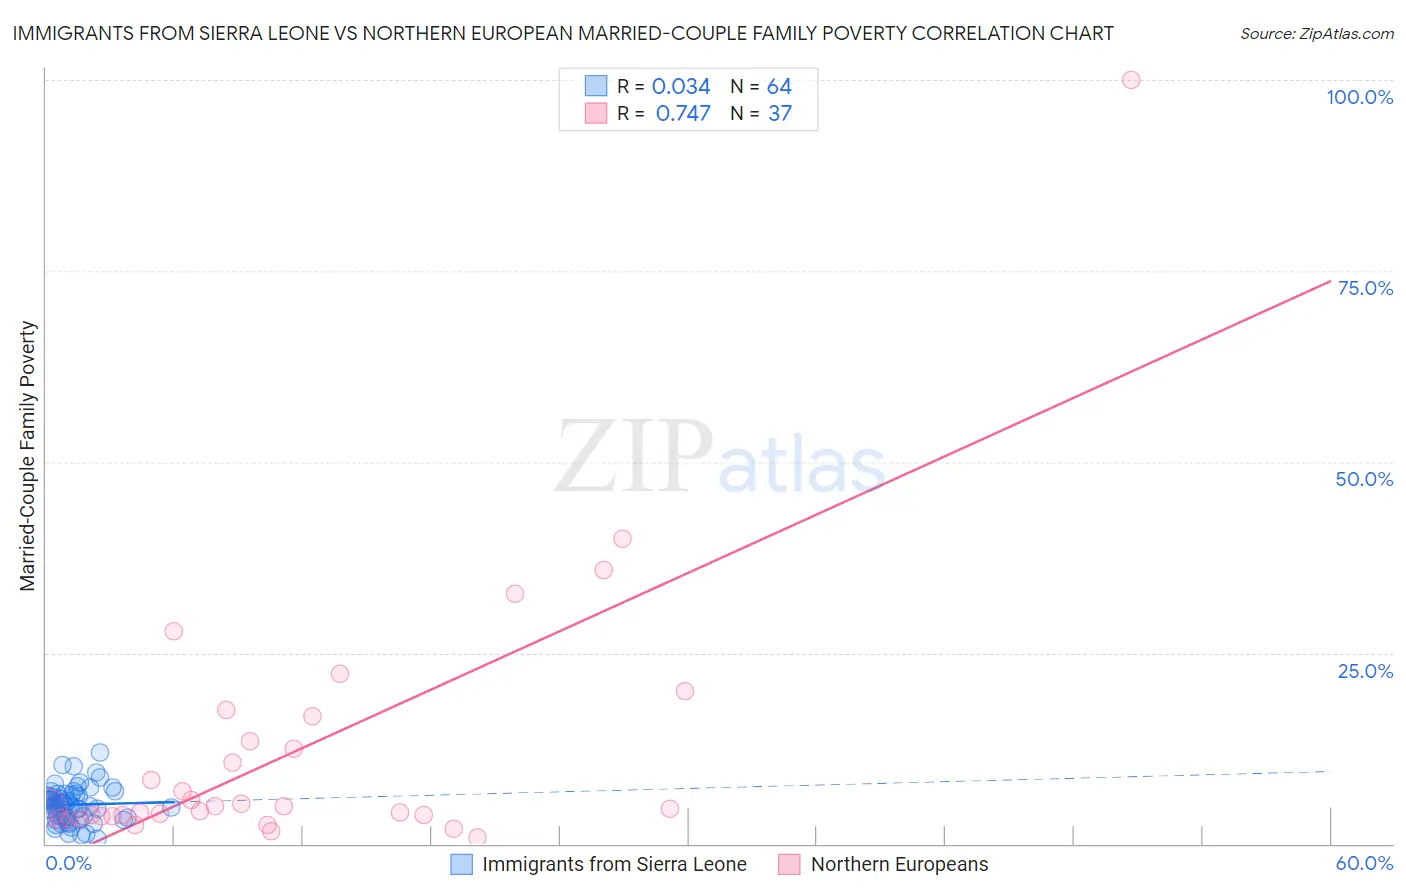
Immigrants from Sierra Leone vs Northern European Married-Couple Family Poverty Correlation Chart
The statistical analysis conducted on geographies consisting of 101,444,500 people shows no correlation between the proportion of Immigrants from Sierra Leone and poverty level among married-couple families in the United States with a correlation coefficient (R) of 0.034 and weighted average of 5.3%. Similarly, the statistical analysis conducted on geographies consisting of 401,488,886 people shows a strong positive correlation between the proportion of Northern Europeans and poverty level among married-couple families in the United States with a correlation coefficient (R) of 0.747 and weighted average of 4.3%, a difference of 24.1%.
Married-Couple Family Poverty Correlation Summary
| Measurement | Immigrants from Sierra Leone | Northern European |
| Minimum | 0.66% | 0.82% |
| Maximum | 12.0% | 100.0% |
| Range | 11.4% | 99.2% |
| Mean | 5.1% | 12.1% |
| Median | 5.1% | 4.8% |
| Interquartile 25% (IQ1) | 3.4% | 3.6% |
| Interquartile 75% (IQ3) | 6.4% | 15.0% |
| Interquartile Range (IQR) | 3.1% | 11.4% |
| Standard Deviation (Sample) | 2.3% | 18.0% |
| Standard Deviation (Population) | 2.3% | 17.8% |
Similar Demographics by Married-Couple Family Poverty
Demographics Similar to Immigrants from Sierra Leone by Married-Couple Family Poverty
In terms of married-couple family poverty, the demographic groups most similar to Immigrants from Sierra Leone are Immigrants from Chile (5.3%, a difference of 0.060%), Immigrants from Vietnam (5.3%, a difference of 0.18%), Peruvian (5.3%, a difference of 0.20%), Spanish (5.3%, a difference of 0.25%), and Nonimmigrants (5.3%, a difference of 0.42%).
| Demographics | Rating | Rank | Married-Couple Family Poverty |
| Alsatians | 51.2 /100 | #173 | Average 5.2% |
| Immigrants | Eastern Africa | 50.0 /100 | #174 | Average 5.2% |
| Marshallese | 47.9 /100 | #175 | Average 5.2% |
| Menominee | 47.8 /100 | #176 | Average 5.2% |
| Immigrants | Kazakhstan | 45.1 /100 | #177 | Average 5.2% |
| Immigrants | Ukraine | 44.9 /100 | #178 | Average 5.2% |
| Spanish | 41.4 /100 | #179 | Average 5.3% |
| Immigrants | Sierra Leone | 39.3 /100 | #180 | Fair 5.3% |
| Immigrants | Chile | 38.8 /100 | #181 | Fair 5.3% |
| Immigrants | Vietnam | 37.7 /100 | #182 | Fair 5.3% |
| Peruvians | 37.6 /100 | #183 | Fair 5.3% |
| Immigrants | Nonimmigrants | 35.8 /100 | #184 | Fair 5.3% |
| Americans | 35.4 /100 | #185 | Fair 5.3% |
| Hungarians | 34.7 /100 | #186 | Fair 5.3% |
| Immigrants | Albania | 33.8 /100 | #187 | Fair 5.3% |
Demographics Similar to Northern Europeans by Married-Couple Family Poverty
In terms of married-couple family poverty, the demographic groups most similar to Northern Europeans are Scottish (4.3%, a difference of 0.16%), French Canadian (4.2%, a difference of 0.25%), Immigrants from Northern Europe (4.2%, a difference of 0.53%), Swiss (4.3%, a difference of 0.60%), and Belgian (4.2%, a difference of 0.66%).
| Demographics | Rating | Rank | Married-Couple Family Poverty |
| Dutch | 99.9 /100 | #34 | Exceptional 4.2% |
| Europeans | 99.9 /100 | #35 | Exceptional 4.2% |
| English | 99.9 /100 | #36 | Exceptional 4.2% |
| Iranians | 99.9 /100 | #37 | Exceptional 4.2% |
| Belgians | 99.9 /100 | #38 | Exceptional 4.2% |
| Immigrants | Northern Europe | 99.8 /100 | #39 | Exceptional 4.2% |
| French Canadians | 99.8 /100 | #40 | Exceptional 4.2% |
| Northern Europeans | 99.8 /100 | #41 | Exceptional 4.3% |
| Scottish | 99.8 /100 | #42 | Exceptional 4.3% |
| Swiss | 99.8 /100 | #43 | Exceptional 4.3% |
| Immigrants | Japan | 99.8 /100 | #44 | Exceptional 4.3% |
| Serbians | 99.8 /100 | #45 | Exceptional 4.3% |
| British | 99.8 /100 | #46 | Exceptional 4.3% |
| Immigrants | South Central Asia | 99.8 /100 | #47 | Exceptional 4.3% |
| Australians | 99.7 /100 | #48 | Exceptional 4.3% |