Immigrants from Sierra Leone vs Liberian Married-Couple Family Poverty
COMPARE
Immigrants from Sierra Leone
Liberian
Married-Couple Family Poverty
Married-Couple Family Poverty Comparison
Immigrants from Sierra Leone
Liberians
5.3%
MARRIED-COUPLE FAMILY POVERTY
39.3/ 100
METRIC RATING
180th/ 347
METRIC RANK
5.4%
MARRIED-COUPLE FAMILY POVERTY
26.3/ 100
METRIC RATING
197th/ 347
METRIC RANK
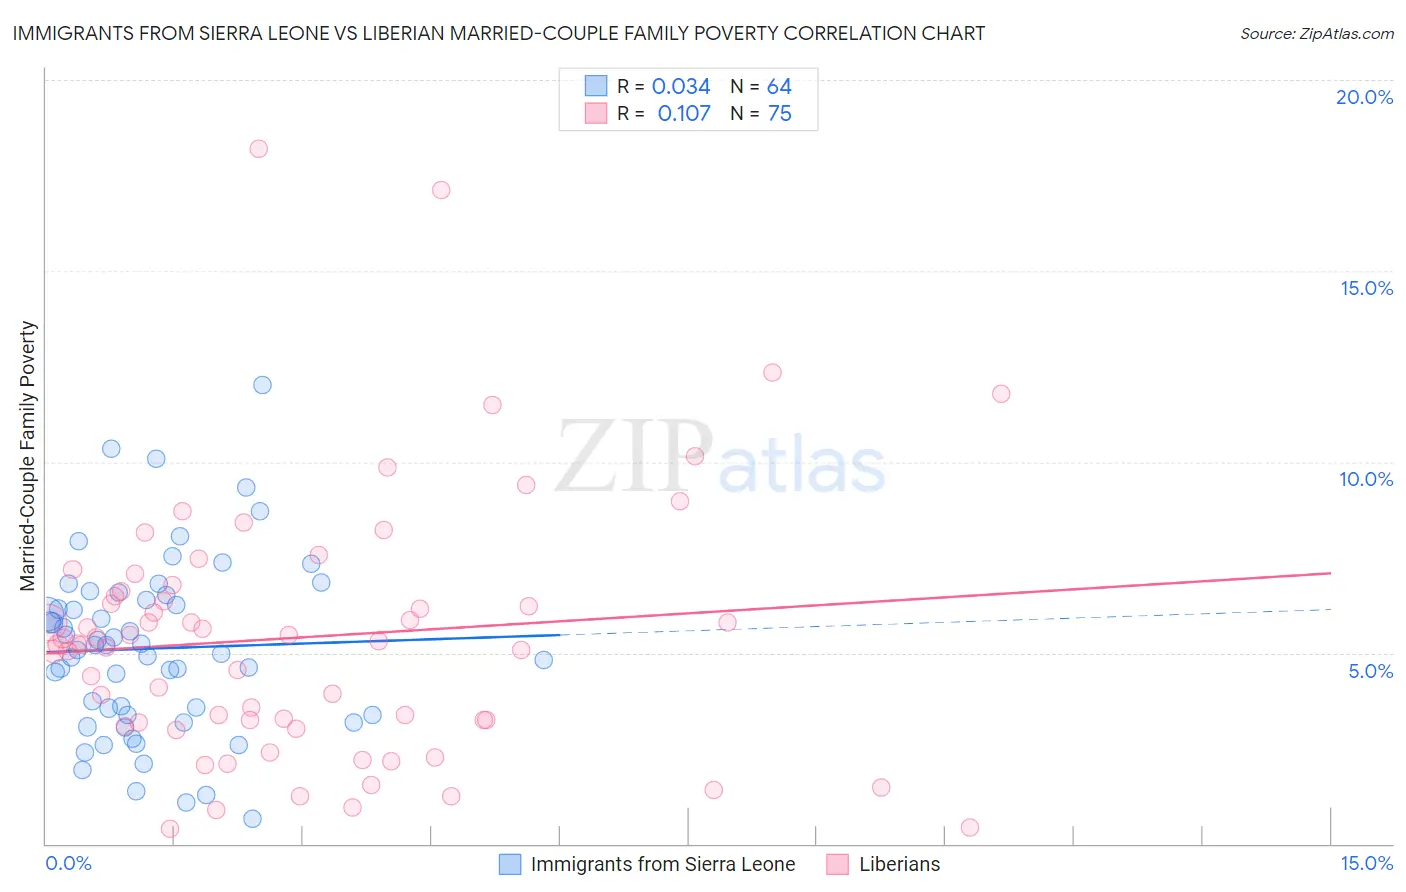
Immigrants from Sierra Leone vs Liberian Married-Couple Family Poverty Correlation Chart
The statistical analysis conducted on geographies consisting of 101,444,500 people shows no correlation between the proportion of Immigrants from Sierra Leone and poverty level among married-couple families in the United States with a correlation coefficient (R) of 0.034 and weighted average of 5.3%. Similarly, the statistical analysis conducted on geographies consisting of 117,684,322 people shows a poor positive correlation between the proportion of Liberians and poverty level among married-couple families in the United States with a correlation coefficient (R) of 0.107 and weighted average of 5.4%, a difference of 1.7%.
Married-Couple Family Poverty Correlation Summary
| Measurement | Immigrants from Sierra Leone | Liberian |
| Minimum | 0.66% | 0.41% |
| Maximum | 12.0% | 18.2% |
| Range | 11.4% | 17.8% |
| Mean | 5.1% | 5.4% |
| Median | 5.1% | 5.2% |
| Interquartile 25% (IQ1) | 3.4% | 3.2% |
| Interquartile 75% (IQ3) | 6.4% | 6.6% |
| Interquartile Range (IQR) | 3.1% | 3.4% |
| Standard Deviation (Sample) | 2.3% | 3.4% |
| Standard Deviation (Population) | 2.3% | 3.4% |
Demographics Similar to Immigrants from Sierra Leone and Liberians by Married-Couple Family Poverty
In terms of married-couple family poverty, the demographic groups most similar to Immigrants from Sierra Leone are Immigrants from Chile (5.3%, a difference of 0.060%), Immigrants from Vietnam (5.3%, a difference of 0.18%), Peruvian (5.3%, a difference of 0.20%), Spanish (5.3%, a difference of 0.25%), and Nonimmigrants (5.3%, a difference of 0.42%). Similarly, the demographic groups most similar to Liberians are Immigrants from Belarus (5.4%, a difference of 0.020%), Spaniard (5.4%, a difference of 0.15%), Immigrants from the Azores (5.4%, a difference of 0.17%), Immigrants from Israel (5.4%, a difference of 0.22%), and Malaysian (5.4%, a difference of 0.44%).
| Demographics | Rating | Rank | Married-Couple Family Poverty |
| Immigrants | Ukraine | 44.9 /100 | #178 | Average 5.2% |
| Spanish | 41.4 /100 | #179 | Average 5.3% |
| Immigrants | Sierra Leone | 39.3 /100 | #180 | Fair 5.3% |
| Immigrants | Chile | 38.8 /100 | #181 | Fair 5.3% |
| Immigrants | Vietnam | 37.7 /100 | #182 | Fair 5.3% |
| Peruvians | 37.6 /100 | #183 | Fair 5.3% |
| Immigrants | Nonimmigrants | 35.8 /100 | #184 | Fair 5.3% |
| Americans | 35.4 /100 | #185 | Fair 5.3% |
| Hungarians | 34.7 /100 | #186 | Fair 5.3% |
| Immigrants | Albania | 33.8 /100 | #187 | Fair 5.3% |
| Israelis | 33.1 /100 | #188 | Fair 5.3% |
| South American Indians | 32.5 /100 | #189 | Fair 5.3% |
| Ugandans | 31.6 /100 | #190 | Fair 5.3% |
| Immigrants | Cabo Verde | 30.9 /100 | #191 | Fair 5.3% |
| Cape Verdeans | 30.7 /100 | #192 | Fair 5.3% |
| Malaysians | 29.5 /100 | #193 | Fair 5.4% |
| Immigrants | Israel | 27.8 /100 | #194 | Fair 5.4% |
| Immigrants | Azores | 27.5 /100 | #195 | Fair 5.4% |
| Spaniards | 27.4 /100 | #196 | Fair 5.4% |
| Liberians | 26.3 /100 | #197 | Fair 5.4% |
| Immigrants | Belarus | 26.2 /100 | #198 | Fair 5.4% |