Immigrants from Sierra Leone vs Pennsylvania German Married-Couple Family Poverty
COMPARE
Immigrants from Sierra Leone
Pennsylvania German
Married-Couple Family Poverty
Married-Couple Family Poverty Comparison
Immigrants from Sierra Leone
Pennsylvania Germans
5.3%
MARRIED-COUPLE FAMILY POVERTY
39.3/ 100
METRIC RATING
180th/ 347
METRIC RANK
5.1%
MARRIED-COUPLE FAMILY POVERTY
68.5/ 100
METRIC RATING
160th/ 347
METRIC RANK
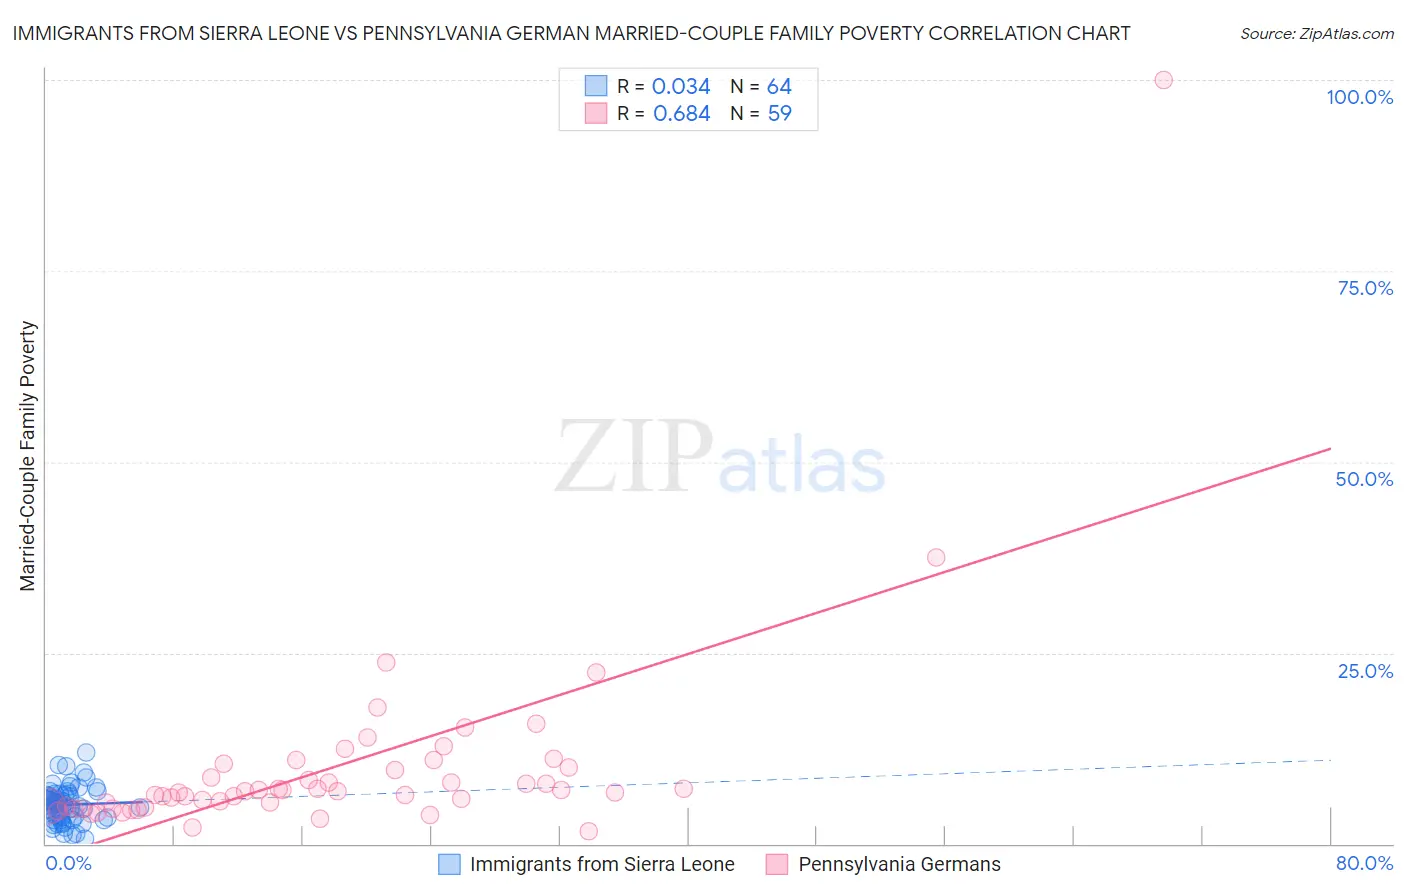
Immigrants from Sierra Leone vs Pennsylvania German Married-Couple Family Poverty Correlation Chart
The statistical analysis conducted on geographies consisting of 101,444,500 people shows no correlation between the proportion of Immigrants from Sierra Leone and poverty level among married-couple families in the United States with a correlation coefficient (R) of 0.034 and weighted average of 5.3%. Similarly, the statistical analysis conducted on geographies consisting of 232,029,160 people shows a significant positive correlation between the proportion of Pennsylvania Germans and poverty level among married-couple families in the United States with a correlation coefficient (R) of 0.684 and weighted average of 5.1%, a difference of 3.6%.
Married-Couple Family Poverty Correlation Summary
| Measurement | Immigrants from Sierra Leone | Pennsylvania German |
| Minimum | 0.66% | 1.6% |
| Maximum | 12.0% | 100.0% |
| Range | 11.4% | 98.4% |
| Mean | 5.1% | 9.9% |
| Median | 5.1% | 6.9% |
| Interquartile 25% (IQ1) | 3.4% | 4.9% |
| Interquartile 75% (IQ3) | 6.4% | 10.0% |
| Interquartile Range (IQR) | 3.1% | 5.1% |
| Standard Deviation (Sample) | 2.3% | 13.3% |
| Standard Deviation (Population) | 2.3% | 13.2% |
Demographics Similar to Immigrants from Sierra Leone and Pennsylvania Germans by Married-Couple Family Poverty
In terms of married-couple family poverty, the demographic groups most similar to Immigrants from Sierra Leone are Spanish (5.3%, a difference of 0.25%), Immigrants from Ukraine (5.2%, a difference of 0.67%), Immigrants from Kazakhstan (5.2%, a difference of 0.69%), Marshallese (5.2%, a difference of 1.0%), and Menominee (5.2%, a difference of 1.0%). Similarly, the demographic groups most similar to Pennsylvania Germans are Ethiopian (5.1%, a difference of 0.060%), Immigrants from Jordan (5.1%, a difference of 0.27%), Sierra Leonean (5.1%, a difference of 0.58%), Hawaiian (5.1%, a difference of 0.82%), and Immigrants from Malaysia (5.1%, a difference of 0.83%).
| Demographics | Rating | Rank | Married-Couple Family Poverty |
| Pennsylvania Germans | 68.5 /100 | #160 | Good 5.1% |
| Ethiopians | 68.1 /100 | #161 | Good 5.1% |
| Immigrants | Jordan | 66.5 /100 | #162 | Good 5.1% |
| Sierra Leoneans | 64.1 /100 | #163 | Good 5.1% |
| Hawaiians | 62.3 /100 | #164 | Good 5.1% |
| Immigrants | Malaysia | 62.2 /100 | #165 | Good 5.1% |
| Paraguayans | 61.5 /100 | #166 | Good 5.1% |
| Costa Ricans | 61.5 /100 | #167 | Good 5.1% |
| Immigrants | Uganda | 54.9 /100 | #168 | Average 5.2% |
| Ottawa | 54.5 /100 | #169 | Average 5.2% |
| Immigrants | Argentina | 54.4 /100 | #170 | Average 5.2% |
| Bermudans | 52.9 /100 | #171 | Average 5.2% |
| Immigrants | Northern Africa | 51.3 /100 | #172 | Average 5.2% |
| Alsatians | 51.2 /100 | #173 | Average 5.2% |
| Immigrants | Eastern Africa | 50.0 /100 | #174 | Average 5.2% |
| Marshallese | 47.9 /100 | #175 | Average 5.2% |
| Menominee | 47.8 /100 | #176 | Average 5.2% |
| Immigrants | Kazakhstan | 45.1 /100 | #177 | Average 5.2% |
| Immigrants | Ukraine | 44.9 /100 | #178 | Average 5.2% |
| Spanish | 41.4 /100 | #179 | Average 5.3% |
| Immigrants | Sierra Leone | 39.3 /100 | #180 | Fair 5.3% |