Immigrants from Sierra Leone vs Immigrants from Hungary Married-Couple Family Poverty
COMPARE
Immigrants from Sierra Leone
Immigrants from Hungary
Married-Couple Family Poverty
Married-Couple Family Poverty Comparison
Immigrants from Sierra Leone
Immigrants from Hungary
5.3%
MARRIED-COUPLE FAMILY POVERTY
39.3/ 100
METRIC RATING
180th/ 347
METRIC RANK
4.9%
MARRIED-COUPLE FAMILY POVERTY
88.7/ 100
METRIC RATING
136th/ 347
METRIC RANK
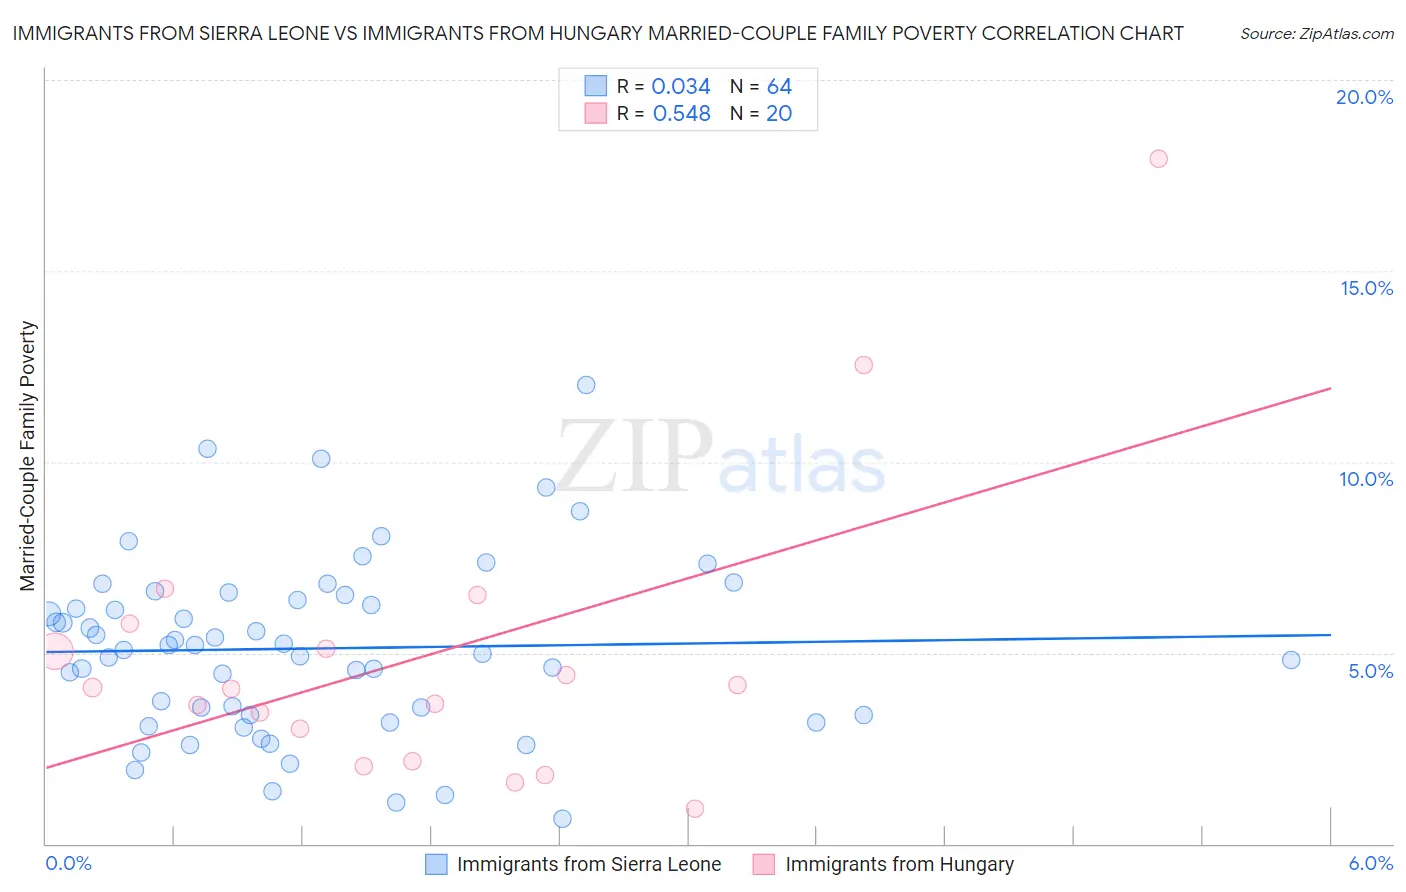
Immigrants from Sierra Leone vs Immigrants from Hungary Married-Couple Family Poverty Correlation Chart
The statistical analysis conducted on geographies consisting of 101,444,500 people shows no correlation between the proportion of Immigrants from Sierra Leone and poverty level among married-couple families in the United States with a correlation coefficient (R) of 0.034 and weighted average of 5.3%. Similarly, the statistical analysis conducted on geographies consisting of 194,814,844 people shows a substantial positive correlation between the proportion of Immigrants from Hungary and poverty level among married-couple families in the United States with a correlation coefficient (R) of 0.548 and weighted average of 4.9%, a difference of 7.7%.
Married-Couple Family Poverty Correlation Summary
| Measurement | Immigrants from Sierra Leone | Immigrants from Hungary |
| Minimum | 0.66% | 0.92% |
| Maximum | 12.0% | 17.9% |
| Range | 11.4% | 17.0% |
| Mean | 5.1% | 4.9% |
| Median | 5.1% | 4.1% |
| Interquartile 25% (IQ1) | 3.4% | 2.6% |
| Interquartile 75% (IQ3) | 6.4% | 5.4% |
| Interquartile Range (IQR) | 3.1% | 2.9% |
| Standard Deviation (Sample) | 2.3% | 4.0% |
| Standard Deviation (Population) | 2.3% | 3.9% |
Similar Demographics by Married-Couple Family Poverty
Demographics Similar to Immigrants from Sierra Leone by Married-Couple Family Poverty
In terms of married-couple family poverty, the demographic groups most similar to Immigrants from Sierra Leone are Immigrants from Chile (5.3%, a difference of 0.060%), Immigrants from Vietnam (5.3%, a difference of 0.18%), Peruvian (5.3%, a difference of 0.20%), Spanish (5.3%, a difference of 0.25%), and Nonimmigrants (5.3%, a difference of 0.42%).
| Demographics | Rating | Rank | Married-Couple Family Poverty |
| Alsatians | 51.2 /100 | #173 | Average 5.2% |
| Immigrants | Eastern Africa | 50.0 /100 | #174 | Average 5.2% |
| Marshallese | 47.9 /100 | #175 | Average 5.2% |
| Menominee | 47.8 /100 | #176 | Average 5.2% |
| Immigrants | Kazakhstan | 45.1 /100 | #177 | Average 5.2% |
| Immigrants | Ukraine | 44.9 /100 | #178 | Average 5.2% |
| Spanish | 41.4 /100 | #179 | Average 5.3% |
| Immigrants | Sierra Leone | 39.3 /100 | #180 | Fair 5.3% |
| Immigrants | Chile | 38.8 /100 | #181 | Fair 5.3% |
| Immigrants | Vietnam | 37.7 /100 | #182 | Fair 5.3% |
| Peruvians | 37.6 /100 | #183 | Fair 5.3% |
| Immigrants | Nonimmigrants | 35.8 /100 | #184 | Fair 5.3% |
| Americans | 35.4 /100 | #185 | Fair 5.3% |
| Hungarians | 34.7 /100 | #186 | Fair 5.3% |
| Immigrants | Albania | 33.8 /100 | #187 | Fair 5.3% |
Demographics Similar to Immigrants from Hungary by Married-Couple Family Poverty
In terms of married-couple family poverty, the demographic groups most similar to Immigrants from Hungary are Assyrian/Chaldean/Syriac (4.9%, a difference of 0.22%), Samoan (4.9%, a difference of 0.50%), Immigrants from Kenya (4.9%, a difference of 0.51%), Puget Sound Salish (4.9%, a difference of 0.58%), and Immigrants from Eastern Europe (4.9%, a difference of 0.59%).
| Demographics | Rating | Rank | Married-Couple Family Poverty |
| Immigrants | Pakistan | 90.7 /100 | #129 | Exceptional 4.9% |
| Soviet Union | 90.7 /100 | #130 | Exceptional 4.9% |
| Immigrants | Eastern Europe | 90.5 /100 | #131 | Exceptional 4.9% |
| Puget Sound Salish | 90.4 /100 | #132 | Exceptional 4.9% |
| Immigrants | Kenya | 90.2 /100 | #133 | Exceptional 4.9% |
| Samoans | 90.2 /100 | #134 | Exceptional 4.9% |
| Assyrians/Chaldeans/Syriacs | 89.4 /100 | #135 | Excellent 4.9% |
| Immigrants | Hungary | 88.7 /100 | #136 | Excellent 4.9% |
| Guamanians/Chamorros | 86.5 /100 | #137 | Excellent 4.9% |
| Chileans | 86.0 /100 | #138 | Excellent 4.9% |
| German Russians | 85.1 /100 | #139 | Excellent 5.0% |
| Immigrants | Portugal | 84.8 /100 | #140 | Excellent 5.0% |
| Immigrants | Brazil | 84.6 /100 | #141 | Excellent 5.0% |
| Immigrants | China | 84.6 /100 | #142 | Excellent 5.0% |
| Immigrants | Egypt | 83.4 /100 | #143 | Excellent 5.0% |