Houma vs New Zealander Single Mother Poverty
COMPARE
Houma
New Zealander
Single Mother Poverty
Single Mother Poverty Comparison
Houma
New Zealanders
43.5%
SINGLE MOTHER POVERTY
0.0/ 100
METRIC RATING
346th/ 347
METRIC RANK
29.1%
SINGLE MOTHER POVERTY
55.1/ 100
METRIC RATING
170th/ 347
METRIC RANK
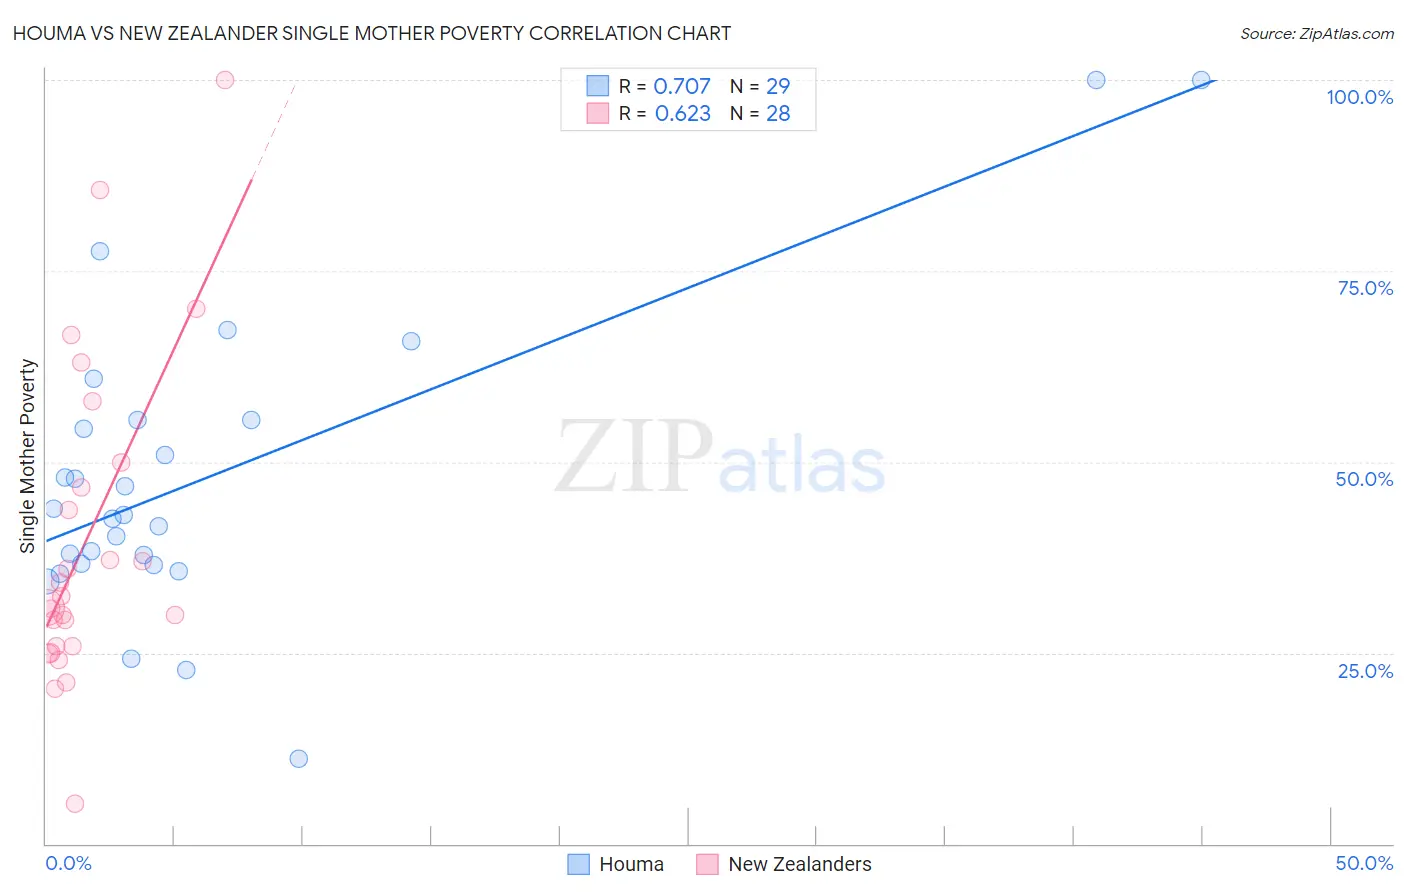
Houma vs New Zealander Single Mother Poverty Correlation Chart
The statistical analysis conducted on geographies consisting of 36,707,466 people shows a strong positive correlation between the proportion of Houma and poverty level among single mothers in the United States with a correlation coefficient (R) of 0.707 and weighted average of 43.5%. Similarly, the statistical analysis conducted on geographies consisting of 105,692,978 people shows a significant positive correlation between the proportion of New Zealanders and poverty level among single mothers in the United States with a correlation coefficient (R) of 0.623 and weighted average of 29.1%, a difference of 49.6%.
Single Mother Poverty Correlation Summary
| Measurement | Houma | New Zealander |
| Minimum | 11.1% | 5.3% |
| Maximum | 100.0% | 100.0% |
| Range | 88.9% | 94.7% |
| Mean | 48.0% | 39.7% |
| Median | 43.1% | 31.7% |
| Interquartile 25% (IQ1) | 36.6% | 25.9% |
| Interquartile 75% (IQ3) | 55.5% | 48.3% |
| Interquartile Range (IQR) | 19.0% | 22.4% |
| Standard Deviation (Sample) | 19.9% | 21.1% |
| Standard Deviation (Population) | 19.6% | 20.8% |
Similar Demographics by Single Mother Poverty
Demographics Similar to Houma by Single Mother Poverty
In terms of single mother poverty, the demographic groups most similar to Houma are Lumbee (43.2%, a difference of 0.62%), Tohono O'odham (43.0%, a difference of 1.1%), Puerto Rican (44.5%, a difference of 2.4%), Cajun (40.3%, a difference of 7.9%), and Navajo (40.2%, a difference of 8.2%).
| Demographics | Rating | Rank | Single Mother Poverty |
| Menominee | 0.0 /100 | #333 | Tragic 37.1% |
| Pueblo | 0.0 /100 | #334 | Tragic 37.2% |
| Yuman | 0.0 /100 | #335 | Tragic 37.8% |
| Cheyenne | 0.0 /100 | #336 | Tragic 38.5% |
| Immigrants | Yemen | 0.0 /100 | #337 | Tragic 38.5% |
| Pima | 0.0 /100 | #338 | Tragic 38.6% |
| Crow | 0.0 /100 | #339 | Tragic 38.6% |
| Sioux | 0.0 /100 | #340 | Tragic 38.8% |
| Colville | 0.0 /100 | #341 | Tragic 39.3% |
| Navajo | 0.0 /100 | #342 | Tragic 40.2% |
| Cajuns | 0.0 /100 | #343 | Tragic 40.3% |
| Tohono O'odham | 0.0 /100 | #344 | Tragic 43.0% |
| Lumbee | 0.0 /100 | #345 | Tragic 43.2% |
| Houma | 0.0 /100 | #346 | Tragic 43.5% |
| Puerto Ricans | 0.0 /100 | #347 | Tragic 44.5% |
Demographics Similar to New Zealanders by Single Mother Poverty
In terms of single mother poverty, the demographic groups most similar to New Zealanders are Puget Sound Salish (29.1%, a difference of 0.0%), Carpatho Rusyn (29.1%, a difference of 0.060%), Immigrants from Uruguay (29.1%, a difference of 0.10%), European (29.1%, a difference of 0.12%), and Costa Rican (29.0%, a difference of 0.16%).
| Demographics | Rating | Rank | Single Mother Poverty |
| Immigrants | Nigeria | 65.9 /100 | #163 | Good 28.9% |
| Immigrants | Kenya | 65.9 /100 | #164 | Good 28.9% |
| Arabs | 60.7 /100 | #165 | Good 29.0% |
| Inupiat | 60.4 /100 | #166 | Good 29.0% |
| Costa Ricans | 58.4 /100 | #167 | Average 29.0% |
| Europeans | 57.6 /100 | #168 | Average 29.1% |
| Immigrants | Uruguay | 57.2 /100 | #169 | Average 29.1% |
| New Zealanders | 55.1 /100 | #170 | Average 29.1% |
| Puget Sound Salish | 55.1 /100 | #171 | Average 29.1% |
| Carpatho Rusyns | 53.8 /100 | #172 | Average 29.1% |
| British | 50.6 /100 | #173 | Average 29.2% |
| Immigrants | Saudi Arabia | 50.0 /100 | #174 | Average 29.2% |
| Immigrants | Costa Rica | 48.8 /100 | #175 | Average 29.2% |
| Hawaiians | 47.8 /100 | #176 | Average 29.2% |
| Immigrants | Bosnia and Herzegovina | 45.1 /100 | #177 | Average 29.2% |