Houma vs Chickasaw Single Mother Poverty
COMPARE
Houma
Chickasaw
Single Mother Poverty
Single Mother Poverty Comparison
Houma
Chickasaw
43.5%
SINGLE MOTHER POVERTY
0.0/ 100
METRIC RATING
346th/ 347
METRIC RANK
34.4%
SINGLE MOTHER POVERTY
0.0/ 100
METRIC RATING
314th/ 347
METRIC RANK
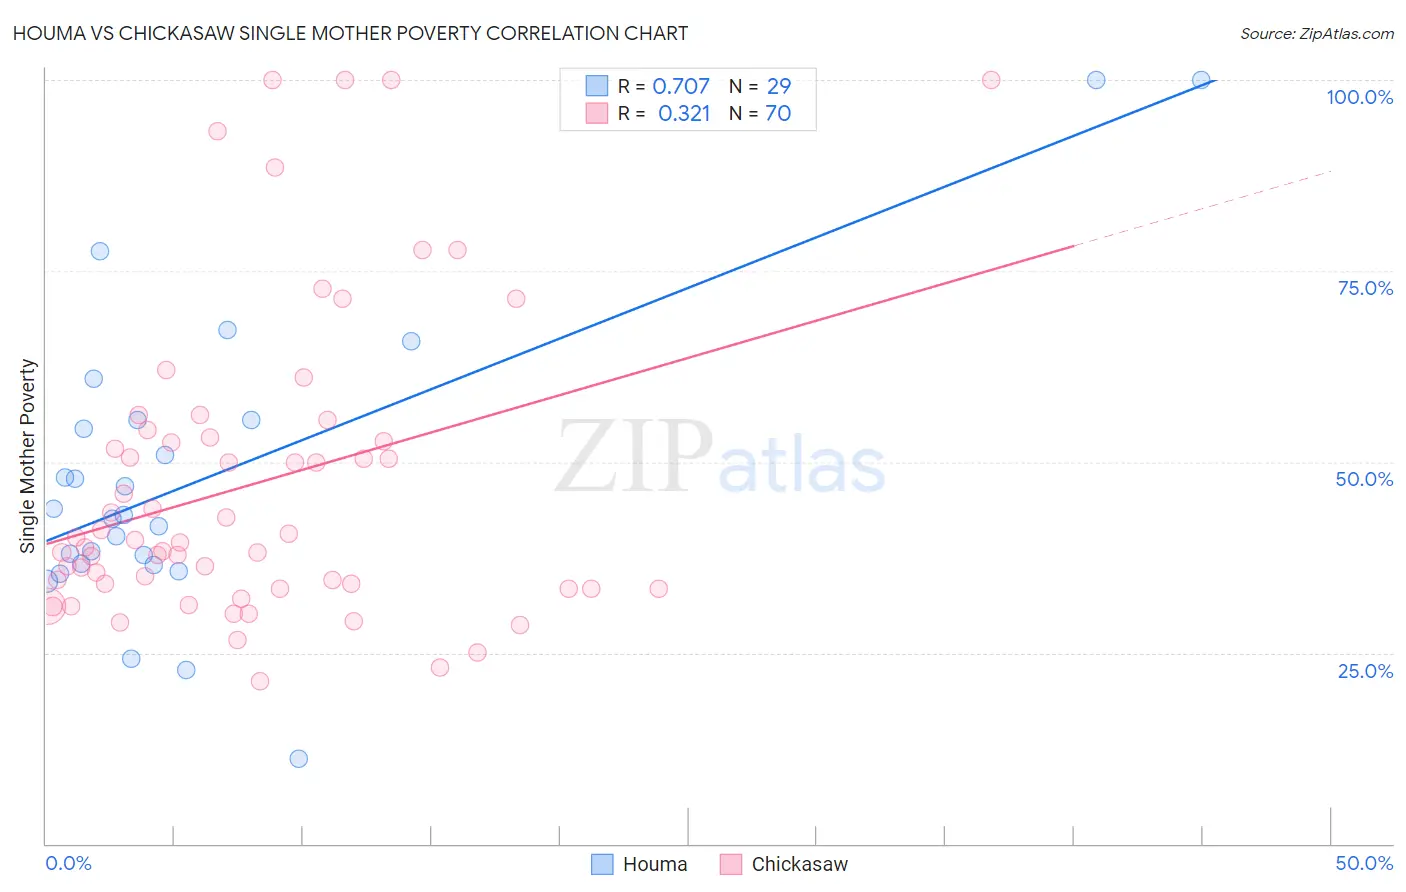
Houma vs Chickasaw Single Mother Poverty Correlation Chart
The statistical analysis conducted on geographies consisting of 36,707,466 people shows a strong positive correlation between the proportion of Houma and poverty level among single mothers in the United States with a correlation coefficient (R) of 0.707 and weighted average of 43.5%. Similarly, the statistical analysis conducted on geographies consisting of 146,526,184 people shows a mild positive correlation between the proportion of Chickasaw and poverty level among single mothers in the United States with a correlation coefficient (R) of 0.321 and weighted average of 34.4%, a difference of 26.4%.
Single Mother Poverty Correlation Summary
| Measurement | Houma | Chickasaw |
| Minimum | 11.1% | 21.2% |
| Maximum | 100.0% | 100.0% |
| Range | 88.9% | 78.7% |
| Mean | 48.0% | 47.2% |
| Median | 43.1% | 39.6% |
| Interquartile 25% (IQ1) | 36.6% | 33.3% |
| Interquartile 75% (IQ3) | 55.5% | 53.2% |
| Interquartile Range (IQR) | 19.0% | 19.9% |
| Standard Deviation (Sample) | 19.9% | 20.0% |
| Standard Deviation (Population) | 19.6% | 19.8% |
Similar Demographics by Single Mother Poverty
Demographics Similar to Houma by Single Mother Poverty
In terms of single mother poverty, the demographic groups most similar to Houma are Lumbee (43.2%, a difference of 0.62%), Tohono O'odham (43.0%, a difference of 1.1%), Puerto Rican (44.5%, a difference of 2.4%), Cajun (40.3%, a difference of 7.9%), and Navajo (40.2%, a difference of 8.2%).
| Demographics | Rating | Rank | Single Mother Poverty |
| Menominee | 0.0 /100 | #333 | Tragic 37.1% |
| Pueblo | 0.0 /100 | #334 | Tragic 37.2% |
| Yuman | 0.0 /100 | #335 | Tragic 37.8% |
| Cheyenne | 0.0 /100 | #336 | Tragic 38.5% |
| Immigrants | Yemen | 0.0 /100 | #337 | Tragic 38.5% |
| Pima | 0.0 /100 | #338 | Tragic 38.6% |
| Crow | 0.0 /100 | #339 | Tragic 38.6% |
| Sioux | 0.0 /100 | #340 | Tragic 38.8% |
| Colville | 0.0 /100 | #341 | Tragic 39.3% |
| Navajo | 0.0 /100 | #342 | Tragic 40.2% |
| Cajuns | 0.0 /100 | #343 | Tragic 40.3% |
| Tohono O'odham | 0.0 /100 | #344 | Tragic 43.0% |
| Lumbee | 0.0 /100 | #345 | Tragic 43.2% |
| Houma | 0.0 /100 | #346 | Tragic 43.5% |
| Puerto Ricans | 0.0 /100 | #347 | Tragic 44.5% |
Demographics Similar to Chickasaw by Single Mother Poverty
In terms of single mother poverty, the demographic groups most similar to Chickasaw are Hopi (34.5%, a difference of 0.080%), Immigrants from Dominican Republic (34.4%, a difference of 0.17%), Dominican (34.5%, a difference of 0.20%), Central American Indian (34.3%, a difference of 0.26%), and Cherokee (34.5%, a difference of 0.30%).
| Demographics | Rating | Rank | Single Mother Poverty |
| Comanche | 0.0 /100 | #307 | Tragic 33.9% |
| Immigrants | Mexico | 0.0 /100 | #308 | Tragic 34.0% |
| Potawatomi | 0.0 /100 | #309 | Tragic 34.1% |
| Hondurans | 0.0 /100 | #310 | Tragic 34.2% |
| Alsatians | 0.0 /100 | #311 | Tragic 34.3% |
| Central American Indians | 0.0 /100 | #312 | Tragic 34.3% |
| Immigrants | Dominican Republic | 0.0 /100 | #313 | Tragic 34.4% |
| Chickasaw | 0.0 /100 | #314 | Tragic 34.4% |
| Hopi | 0.0 /100 | #315 | Tragic 34.5% |
| Dominicans | 0.0 /100 | #316 | Tragic 34.5% |
| Cherokee | 0.0 /100 | #317 | Tragic 34.5% |
| Immigrants | Honduras | 0.0 /100 | #318 | Tragic 34.7% |
| Chippewa | 0.0 /100 | #319 | Tragic 34.8% |
| Iroquois | 0.0 /100 | #320 | Tragic 34.8% |
| Paiute | 0.0 /100 | #321 | Tragic 35.1% |