Houma vs Immigrants from Nepal Single Mother Poverty
COMPARE
Houma
Immigrants from Nepal
Single Mother Poverty
Single Mother Poverty Comparison
Houma
Immigrants from Nepal
43.5%
SINGLE MOTHER POVERTY
0.0/ 100
METRIC RATING
346th/ 347
METRIC RANK
27.9%
SINGLE MOTHER POVERTY
97.2/ 100
METRIC RATING
98th/ 347
METRIC RANK
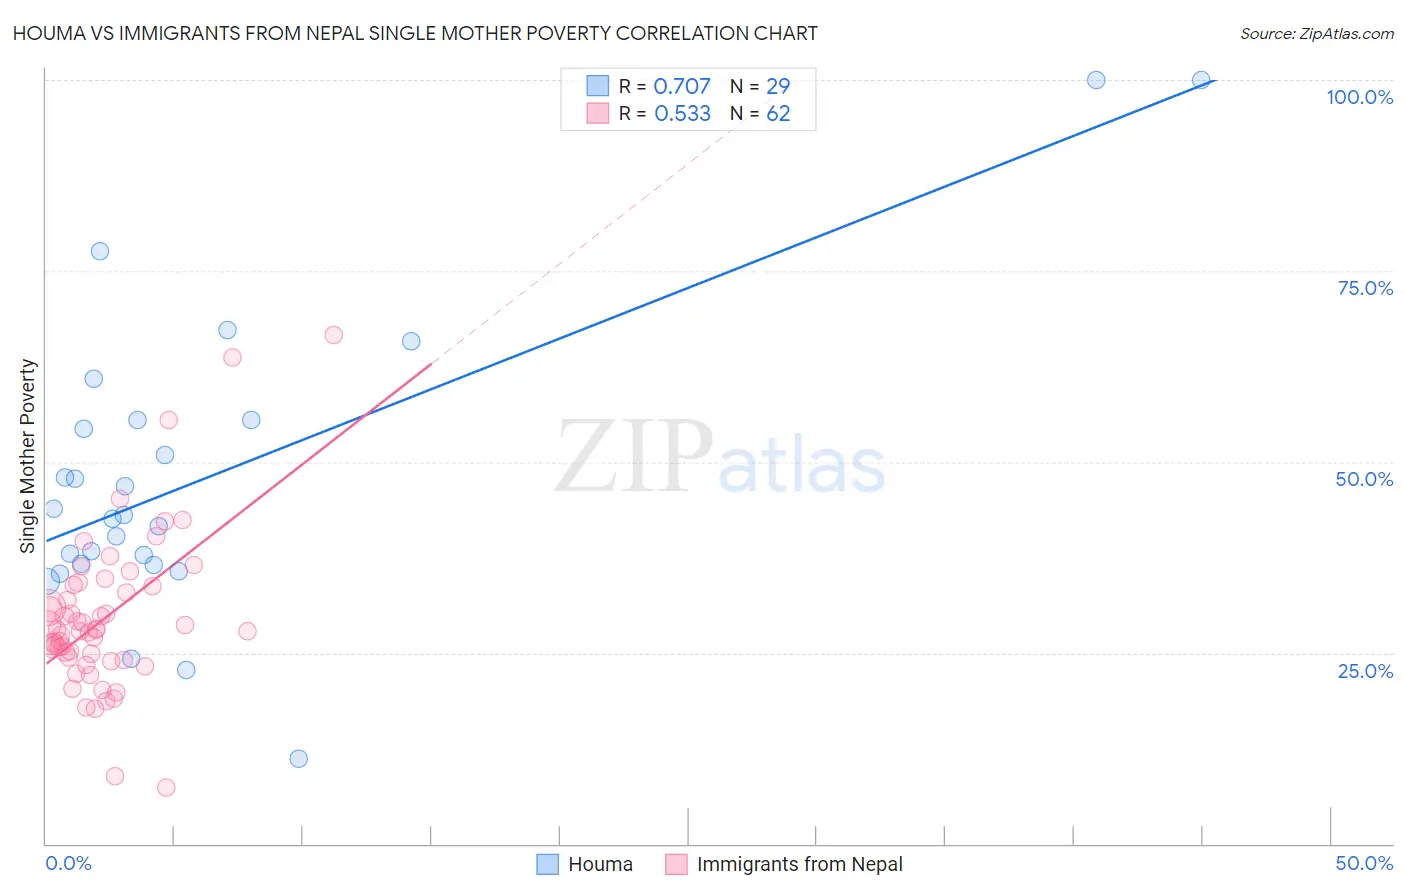
Houma vs Immigrants from Nepal Single Mother Poverty Correlation Chart
The statistical analysis conducted on geographies consisting of 36,707,466 people shows a strong positive correlation between the proportion of Houma and poverty level among single mothers in the United States with a correlation coefficient (R) of 0.707 and weighted average of 43.5%. Similarly, the statistical analysis conducted on geographies consisting of 184,396,639 people shows a substantial positive correlation between the proportion of Immigrants from Nepal and poverty level among single mothers in the United States with a correlation coefficient (R) of 0.533 and weighted average of 27.9%, a difference of 55.8%.
Single Mother Poverty Correlation Summary
| Measurement | Houma | Immigrants from Nepal |
| Minimum | 11.1% | 7.4% |
| Maximum | 100.0% | 66.7% |
| Range | 88.9% | 59.3% |
| Mean | 48.0% | 29.5% |
| Median | 43.1% | 27.9% |
| Interquartile 25% (IQ1) | 36.6% | 24.4% |
| Interquartile 75% (IQ3) | 55.5% | 33.7% |
| Interquartile Range (IQR) | 19.0% | 9.3% |
| Standard Deviation (Sample) | 19.9% | 10.3% |
| Standard Deviation (Population) | 19.6% | 10.2% |
Similar Demographics by Single Mother Poverty
Demographics Similar to Houma by Single Mother Poverty
In terms of single mother poverty, the demographic groups most similar to Houma are Lumbee (43.2%, a difference of 0.62%), Tohono O'odham (43.0%, a difference of 1.1%), Puerto Rican (44.5%, a difference of 2.4%), Cajun (40.3%, a difference of 7.9%), and Navajo (40.2%, a difference of 8.2%).
| Demographics | Rating | Rank | Single Mother Poverty |
| Menominee | 0.0 /100 | #333 | Tragic 37.1% |
| Pueblo | 0.0 /100 | #334 | Tragic 37.2% |
| Yuman | 0.0 /100 | #335 | Tragic 37.8% |
| Cheyenne | 0.0 /100 | #336 | Tragic 38.5% |
| Immigrants | Yemen | 0.0 /100 | #337 | Tragic 38.5% |
| Pima | 0.0 /100 | #338 | Tragic 38.6% |
| Crow | 0.0 /100 | #339 | Tragic 38.6% |
| Sioux | 0.0 /100 | #340 | Tragic 38.8% |
| Colville | 0.0 /100 | #341 | Tragic 39.3% |
| Navajo | 0.0 /100 | #342 | Tragic 40.2% |
| Cajuns | 0.0 /100 | #343 | Tragic 40.3% |
| Tohono O'odham | 0.0 /100 | #344 | Tragic 43.0% |
| Lumbee | 0.0 /100 | #345 | Tragic 43.2% |
| Houma | 0.0 /100 | #346 | Tragic 43.5% |
| Puerto Ricans | 0.0 /100 | #347 | Tragic 44.5% |
Demographics Similar to Immigrants from Nepal by Single Mother Poverty
In terms of single mother poverty, the demographic groups most similar to Immigrants from Nepal are Immigrants from Brazil (27.9%, a difference of 0.010%), Immigrants from Netherlands (27.9%, a difference of 0.010%), Immigrants from Iraq (27.9%, a difference of 0.050%), Zimbabwean (27.9%, a difference of 0.060%), and Pakistani (28.0%, a difference of 0.12%).
| Demographics | Rating | Rank | Single Mother Poverty |
| Immigrants | Albania | 98.0 /100 | #91 | Exceptional 27.8% |
| Estonians | 97.9 /100 | #92 | Exceptional 27.8% |
| Romanians | 97.8 /100 | #93 | Exceptional 27.8% |
| Albanians | 97.6 /100 | #94 | Exceptional 27.9% |
| Chileans | 97.5 /100 | #95 | Exceptional 27.9% |
| Immigrants | Iraq | 97.3 /100 | #96 | Exceptional 27.9% |
| Immigrants | Brazil | 97.2 /100 | #97 | Exceptional 27.9% |
| Immigrants | Nepal | 97.2 /100 | #98 | Exceptional 27.9% |
| Immigrants | Netherlands | 97.2 /100 | #99 | Exceptional 27.9% |
| Zimbabweans | 97.1 /100 | #100 | Exceptional 27.9% |
| Pakistanis | 96.9 /100 | #101 | Exceptional 28.0% |
| Immigrants | Croatia | 96.7 /100 | #102 | Exceptional 28.0% |
| Immigrants | Northern Africa | 96.6 /100 | #103 | Exceptional 28.0% |
| Italians | 96.6 /100 | #104 | Exceptional 28.0% |
| Israelis | 96.5 /100 | #105 | Exceptional 28.0% |