Immigrants from Chile vs New Zealander Single Mother Poverty
COMPARE
Immigrants from Chile
New Zealander
Single Mother Poverty
Single Mother Poverty Comparison
Immigrants from Chile
New Zealanders
28.4%
SINGLE MOTHER POVERTY
90.8/ 100
METRIC RATING
126th/ 347
METRIC RANK
29.1%
SINGLE MOTHER POVERTY
55.1/ 100
METRIC RATING
170th/ 347
METRIC RANK
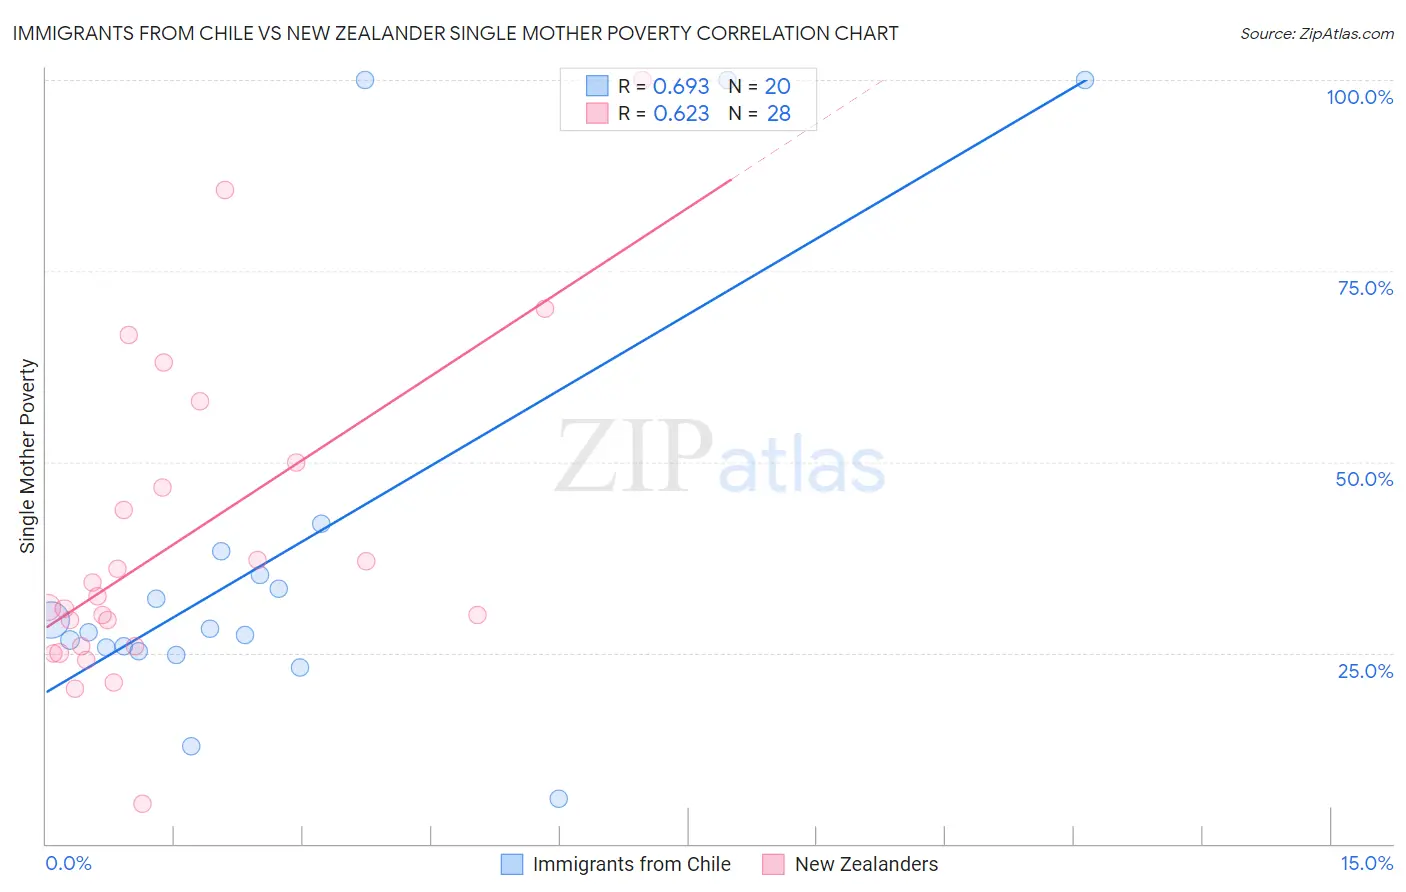
Immigrants from Chile vs New Zealander Single Mother Poverty Correlation Chart
The statistical analysis conducted on geographies consisting of 215,689,782 people shows a significant positive correlation between the proportion of Immigrants from Chile and poverty level among single mothers in the United States with a correlation coefficient (R) of 0.693 and weighted average of 28.4%. Similarly, the statistical analysis conducted on geographies consisting of 105,692,978 people shows a significant positive correlation between the proportion of New Zealanders and poverty level among single mothers in the United States with a correlation coefficient (R) of 0.623 and weighted average of 29.1%, a difference of 2.6%.
Single Mother Poverty Correlation Summary
| Measurement | Immigrants from Chile | New Zealander |
| Minimum | 5.9% | 5.3% |
| Maximum | 100.0% | 100.0% |
| Range | 94.1% | 94.7% |
| Mean | 38.1% | 39.7% |
| Median | 27.9% | 31.7% |
| Interquartile 25% (IQ1) | 25.4% | 25.9% |
| Interquartile 75% (IQ3) | 36.7% | 48.3% |
| Interquartile Range (IQR) | 11.3% | 22.4% |
| Standard Deviation (Sample) | 27.8% | 21.1% |
| Standard Deviation (Population) | 27.1% | 20.8% |
Similar Demographics by Single Mother Poverty
Demographics Similar to Immigrants from Chile by Single Mother Poverty
In terms of single mother poverty, the demographic groups most similar to Immigrants from Chile are Kenyan (28.4%, a difference of 0.010%), Polish (28.4%, a difference of 0.010%), Immigrants from England (28.4%, a difference of 0.040%), South American (28.4%, a difference of 0.070%), and Norwegian (28.4%, a difference of 0.070%).
| Demographics | Rating | Rank | Single Mother Poverty |
| Immigrants | Syria | 92.4 /100 | #119 | Exceptional 28.3% |
| Cypriots | 92.3 /100 | #120 | Exceptional 28.3% |
| Immigrants | Afghanistan | 92.1 /100 | #121 | Exceptional 28.3% |
| Colombians | 91.8 /100 | #122 | Exceptional 28.3% |
| Uruguayans | 91.7 /100 | #123 | Exceptional 28.3% |
| Immigrants | Switzerland | 91.7 /100 | #124 | Exceptional 28.3% |
| Kenyans | 90.9 /100 | #125 | Exceptional 28.4% |
| Immigrants | Chile | 90.8 /100 | #126 | Exceptional 28.4% |
| Poles | 90.8 /100 | #127 | Exceptional 28.4% |
| Immigrants | England | 90.5 /100 | #128 | Exceptional 28.4% |
| South Americans | 90.4 /100 | #129 | Exceptional 28.4% |
| Norwegians | 90.4 /100 | #130 | Exceptional 28.4% |
| Immigrants | Austria | 90.3 /100 | #131 | Exceptional 28.4% |
| Immigrants | Morocco | 89.5 /100 | #132 | Excellent 28.4% |
| Swedes | 89.4 /100 | #133 | Excellent 28.4% |
Demographics Similar to New Zealanders by Single Mother Poverty
In terms of single mother poverty, the demographic groups most similar to New Zealanders are Puget Sound Salish (29.1%, a difference of 0.0%), Carpatho Rusyn (29.1%, a difference of 0.060%), Immigrants from Uruguay (29.1%, a difference of 0.10%), European (29.1%, a difference of 0.12%), and Costa Rican (29.0%, a difference of 0.16%).
| Demographics | Rating | Rank | Single Mother Poverty |
| Immigrants | Nigeria | 65.9 /100 | #163 | Good 28.9% |
| Immigrants | Kenya | 65.9 /100 | #164 | Good 28.9% |
| Arabs | 60.7 /100 | #165 | Good 29.0% |
| Inupiat | 60.4 /100 | #166 | Good 29.0% |
| Costa Ricans | 58.4 /100 | #167 | Average 29.0% |
| Europeans | 57.6 /100 | #168 | Average 29.1% |
| Immigrants | Uruguay | 57.2 /100 | #169 | Average 29.1% |
| New Zealanders | 55.1 /100 | #170 | Average 29.1% |
| Puget Sound Salish | 55.1 /100 | #171 | Average 29.1% |
| Carpatho Rusyns | 53.8 /100 | #172 | Average 29.1% |
| British | 50.6 /100 | #173 | Average 29.2% |
| Immigrants | Saudi Arabia | 50.0 /100 | #174 | Average 29.2% |
| Immigrants | Costa Rica | 48.8 /100 | #175 | Average 29.2% |
| Hawaiians | 47.8 /100 | #176 | Average 29.2% |
| Immigrants | Bosnia and Herzegovina | 45.1 /100 | #177 | Average 29.2% |