Houma vs Immigrants from Bulgaria Single Mother Poverty
COMPARE
Houma
Immigrants from Bulgaria
Single Mother Poverty
Single Mother Poverty Comparison
Houma
Immigrants from Bulgaria
43.5%
SINGLE MOTHER POVERTY
0.0/ 100
METRIC RATING
346th/ 347
METRIC RANK
27.1%
SINGLE MOTHER POVERTY
99.7/ 100
METRIC RATING
54th/ 347
METRIC RANK
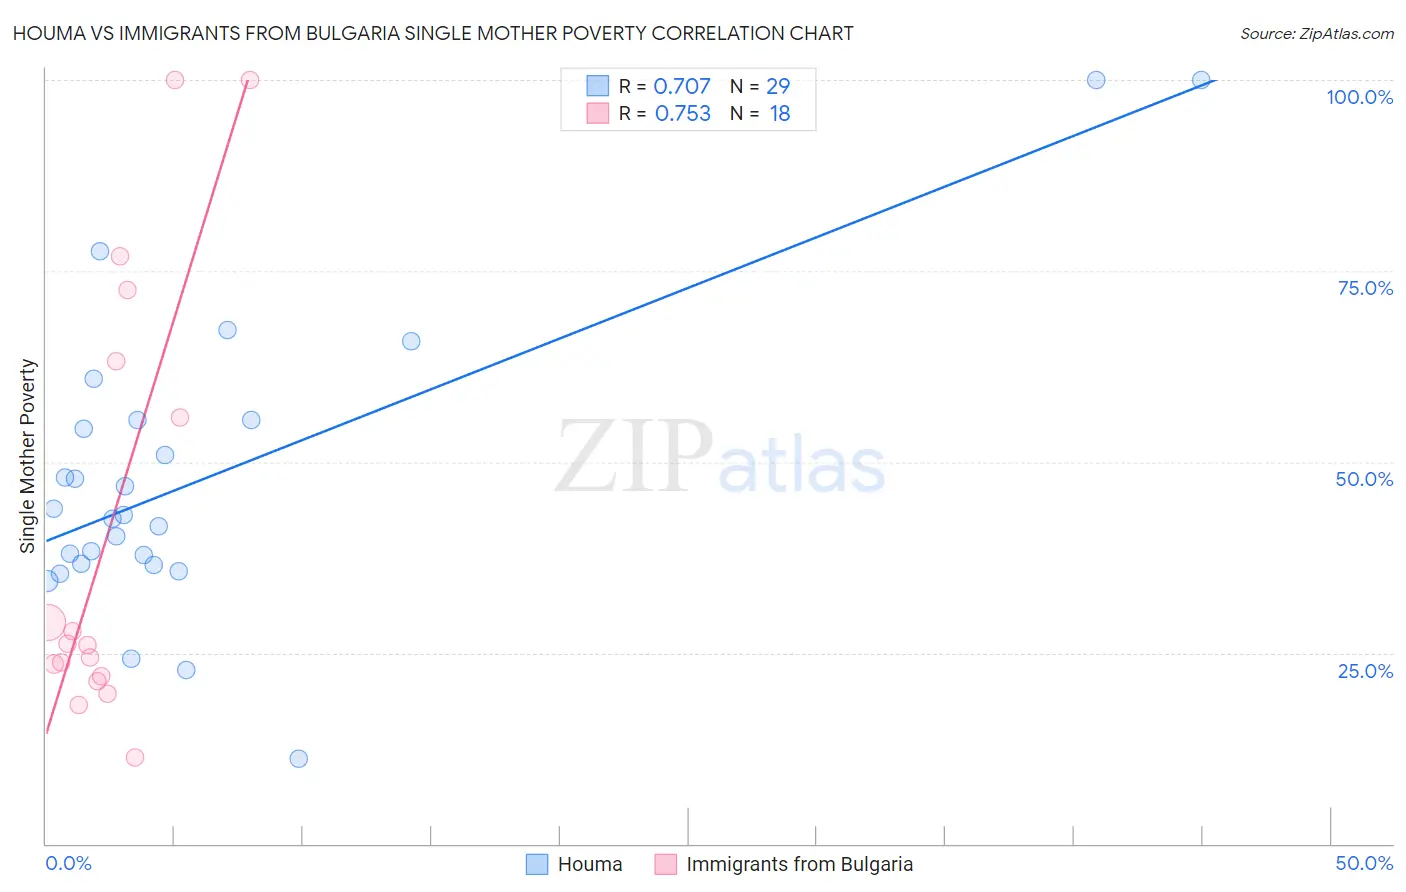
Houma vs Immigrants from Bulgaria Single Mother Poverty Correlation Chart
The statistical analysis conducted on geographies consisting of 36,707,466 people shows a strong positive correlation between the proportion of Houma and poverty level among single mothers in the United States with a correlation coefficient (R) of 0.707 and weighted average of 43.5%. Similarly, the statistical analysis conducted on geographies consisting of 170,164,064 people shows a strong positive correlation between the proportion of Immigrants from Bulgaria and poverty level among single mothers in the United States with a correlation coefficient (R) of 0.753 and weighted average of 27.1%, a difference of 60.4%.
Single Mother Poverty Correlation Summary
| Measurement | Houma | Immigrants from Bulgaria |
| Minimum | 11.1% | 11.3% |
| Maximum | 100.0% | 100.0% |
| Range | 88.9% | 88.7% |
| Mean | 48.0% | 41.2% |
| Median | 43.1% | 26.1% |
| Interquartile 25% (IQ1) | 36.6% | 22.0% |
| Interquartile 75% (IQ3) | 55.5% | 63.2% |
| Interquartile Range (IQR) | 19.0% | 41.2% |
| Standard Deviation (Sample) | 19.9% | 28.9% |
| Standard Deviation (Population) | 19.6% | 28.1% |
Similar Demographics by Single Mother Poverty
Demographics Similar to Houma by Single Mother Poverty
In terms of single mother poverty, the demographic groups most similar to Houma are Lumbee (43.2%, a difference of 0.62%), Tohono O'odham (43.0%, a difference of 1.1%), Puerto Rican (44.5%, a difference of 2.4%), Cajun (40.3%, a difference of 7.9%), and Navajo (40.2%, a difference of 8.2%).
| Demographics | Rating | Rank | Single Mother Poverty |
| Menominee | 0.0 /100 | #333 | Tragic 37.1% |
| Pueblo | 0.0 /100 | #334 | Tragic 37.2% |
| Yuman | 0.0 /100 | #335 | Tragic 37.8% |
| Cheyenne | 0.0 /100 | #336 | Tragic 38.5% |
| Immigrants | Yemen | 0.0 /100 | #337 | Tragic 38.5% |
| Pima | 0.0 /100 | #338 | Tragic 38.6% |
| Crow | 0.0 /100 | #339 | Tragic 38.6% |
| Sioux | 0.0 /100 | #340 | Tragic 38.8% |
| Colville | 0.0 /100 | #341 | Tragic 39.3% |
| Navajo | 0.0 /100 | #342 | Tragic 40.2% |
| Cajuns | 0.0 /100 | #343 | Tragic 40.3% |
| Tohono O'odham | 0.0 /100 | #344 | Tragic 43.0% |
| Lumbee | 0.0 /100 | #345 | Tragic 43.2% |
| Houma | 0.0 /100 | #346 | Tragic 43.5% |
| Puerto Ricans | 0.0 /100 | #347 | Tragic 44.5% |
Demographics Similar to Immigrants from Bulgaria by Single Mother Poverty
In terms of single mother poverty, the demographic groups most similar to Immigrants from Bulgaria are Immigrants from Jordan (27.1%, a difference of 0.030%), Immigrants from Egypt (27.1%, a difference of 0.030%), Immigrants from South Eastern Asia (27.1%, a difference of 0.070%), Immigrants from Romania (27.2%, a difference of 0.080%), and Immigrants from Argentina (27.1%, a difference of 0.11%).
| Demographics | Rating | Rank | Single Mother Poverty |
| Egyptians | 99.8 /100 | #47 | Exceptional 26.9% |
| Immigrants | Poland | 99.8 /100 | #48 | Exceptional 26.9% |
| Cambodians | 99.8 /100 | #49 | Exceptional 27.0% |
| Laotians | 99.8 /100 | #50 | Exceptional 27.0% |
| Immigrants | Argentina | 99.7 /100 | #51 | Exceptional 27.1% |
| Immigrants | South Eastern Asia | 99.7 /100 | #52 | Exceptional 27.1% |
| Immigrants | Jordan | 99.7 /100 | #53 | Exceptional 27.1% |
| Immigrants | Bulgaria | 99.7 /100 | #54 | Exceptional 27.1% |
| Immigrants | Egypt | 99.7 /100 | #55 | Exceptional 27.1% |
| Immigrants | Romania | 99.7 /100 | #56 | Exceptional 27.2% |
| Palestinians | 99.7 /100 | #57 | Exceptional 27.2% |
| Argentineans | 99.6 /100 | #58 | Exceptional 27.2% |
| Paraguayans | 99.6 /100 | #59 | Exceptional 27.2% |
| Eastern Europeans | 99.6 /100 | #60 | Exceptional 27.2% |
| Immigrants | Eastern Europe | 99.6 /100 | #61 | Exceptional 27.2% |