Houma vs Bermudan Single Mother Poverty
COMPARE
Houma
Bermudan
Single Mother Poverty
Single Mother Poverty Comparison
Houma
Bermudans
43.5%
SINGLE MOTHER POVERTY
0.0/ 100
METRIC RATING
346th/ 347
METRIC RANK
30.6%
SINGLE MOTHER POVERTY
1.6/ 100
METRIC RATING
243rd/ 347
METRIC RANK
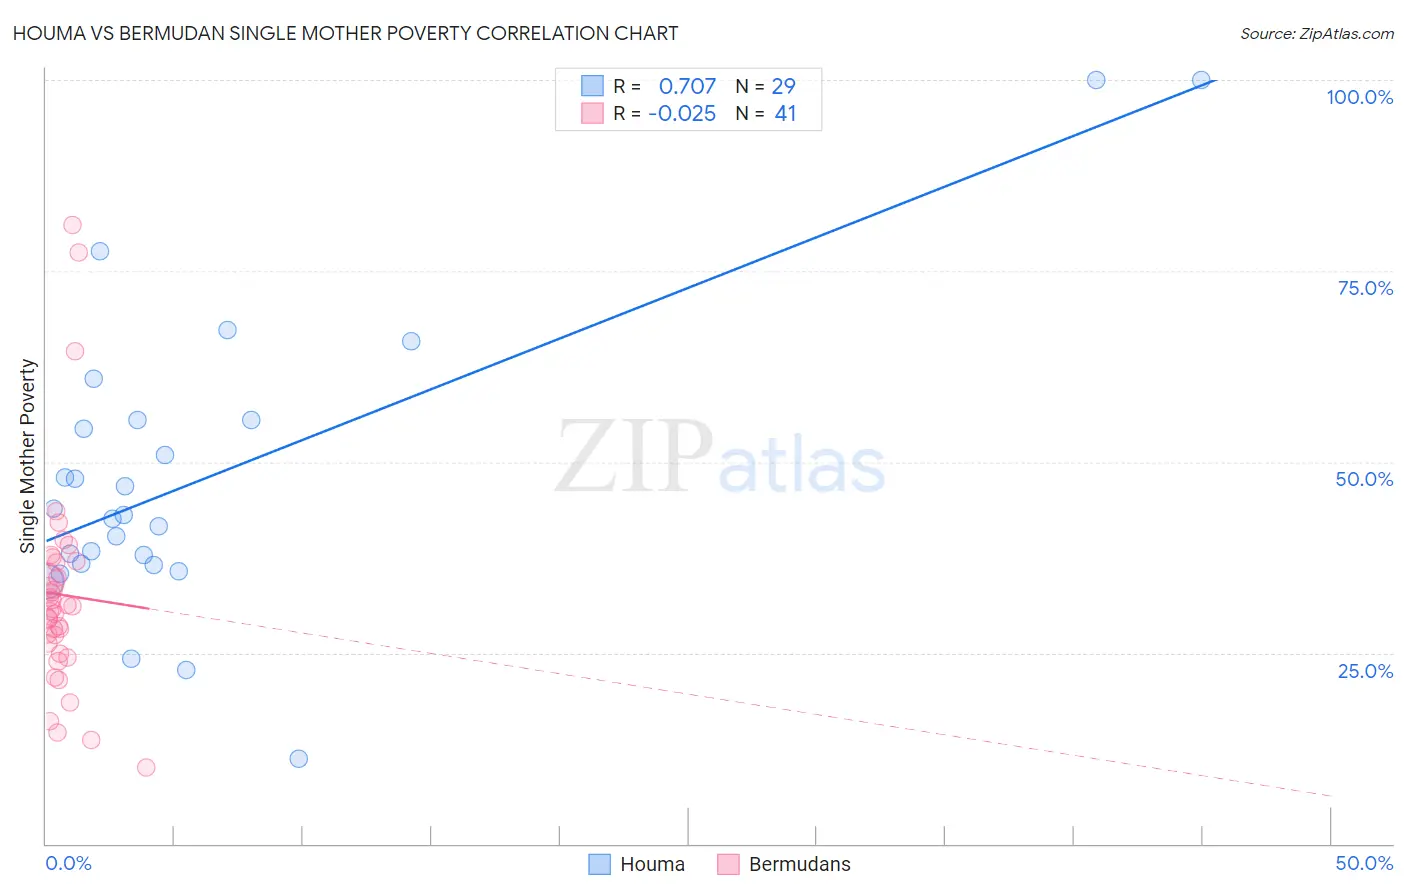
Houma vs Bermudan Single Mother Poverty Correlation Chart
The statistical analysis conducted on geographies consisting of 36,707,466 people shows a strong positive correlation between the proportion of Houma and poverty level among single mothers in the United States with a correlation coefficient (R) of 0.707 and weighted average of 43.5%. Similarly, the statistical analysis conducted on geographies consisting of 55,530,173 people shows no correlation between the proportion of Bermudans and poverty level among single mothers in the United States with a correlation coefficient (R) of -0.025 and weighted average of 30.6%, a difference of 42.2%.
Single Mother Poverty Correlation Summary
| Measurement | Houma | Bermudan |
| Minimum | 11.1% | 10.0% |
| Maximum | 100.0% | 81.0% |
| Range | 88.9% | 71.0% |
| Mean | 48.0% | 32.6% |
| Median | 43.1% | 30.7% |
| Interquartile 25% (IQ1) | 36.6% | 25.5% |
| Interquartile 75% (IQ3) | 55.5% | 36.9% |
| Interquartile Range (IQR) | 19.0% | 11.3% |
| Standard Deviation (Sample) | 19.9% | 14.2% |
| Standard Deviation (Population) | 19.6% | 14.0% |
Similar Demographics by Single Mother Poverty
Demographics Similar to Houma by Single Mother Poverty
In terms of single mother poverty, the demographic groups most similar to Houma are Lumbee (43.2%, a difference of 0.62%), Tohono O'odham (43.0%, a difference of 1.1%), Puerto Rican (44.5%, a difference of 2.4%), Cajun (40.3%, a difference of 7.9%), and Navajo (40.2%, a difference of 8.2%).
| Demographics | Rating | Rank | Single Mother Poverty |
| Menominee | 0.0 /100 | #333 | Tragic 37.1% |
| Pueblo | 0.0 /100 | #334 | Tragic 37.2% |
| Yuman | 0.0 /100 | #335 | Tragic 37.8% |
| Cheyenne | 0.0 /100 | #336 | Tragic 38.5% |
| Immigrants | Yemen | 0.0 /100 | #337 | Tragic 38.5% |
| Pima | 0.0 /100 | #338 | Tragic 38.6% |
| Crow | 0.0 /100 | #339 | Tragic 38.6% |
| Sioux | 0.0 /100 | #340 | Tragic 38.8% |
| Colville | 0.0 /100 | #341 | Tragic 39.3% |
| Navajo | 0.0 /100 | #342 | Tragic 40.2% |
| Cajuns | 0.0 /100 | #343 | Tragic 40.3% |
| Tohono O'odham | 0.0 /100 | #344 | Tragic 43.0% |
| Lumbee | 0.0 /100 | #345 | Tragic 43.2% |
| Houma | 0.0 /100 | #346 | Tragic 43.5% |
| Puerto Ricans | 0.0 /100 | #347 | Tragic 44.5% |
Demographics Similar to Bermudans by Single Mother Poverty
In terms of single mother poverty, the demographic groups most similar to Bermudans are Immigrants from Burma/Myanmar (30.6%, a difference of 0.080%), Immigrants from Laos (30.6%, a difference of 0.10%), Salvadoran (30.6%, a difference of 0.15%), French (30.7%, a difference of 0.22%), and Barbadian (30.7%, a difference of 0.23%).
| Demographics | Rating | Rank | Single Mother Poverty |
| Welsh | 3.2 /100 | #236 | Tragic 30.4% |
| Immigrants | St. Vincent and the Grenadines | 3.1 /100 | #237 | Tragic 30.4% |
| Slovaks | 2.8 /100 | #238 | Tragic 30.4% |
| Immigrants | Portugal | 2.1 /100 | #239 | Tragic 30.5% |
| Salvadorans | 1.8 /100 | #240 | Tragic 30.6% |
| Immigrants | Laos | 1.8 /100 | #241 | Tragic 30.6% |
| Immigrants | Burma/Myanmar | 1.7 /100 | #242 | Tragic 30.6% |
| Bermudans | 1.6 /100 | #243 | Tragic 30.6% |
| French | 1.3 /100 | #244 | Tragic 30.7% |
| Barbadians | 1.3 /100 | #245 | Tragic 30.7% |
| Ecuadorians | 0.9 /100 | #246 | Tragic 30.8% |
| West Indians | 0.9 /100 | #247 | Tragic 30.8% |
| French Canadians | 0.9 /100 | #248 | Tragic 30.8% |
| Cape Verdeans | 0.8 /100 | #249 | Tragic 30.8% |
| Vietnamese | 0.7 /100 | #250 | Tragic 30.9% |