Houma vs Immigrants from El Salvador Single Mother Poverty
COMPARE
Houma
Immigrants from El Salvador
Single Mother Poverty
Single Mother Poverty Comparison
Houma
Immigrants from El Salvador
43.5%
SINGLE MOTHER POVERTY
0.0/ 100
METRIC RATING
346th/ 347
METRIC RANK
31.2%
SINGLE MOTHER POVERTY
0.3/ 100
METRIC RATING
261st/ 347
METRIC RANK
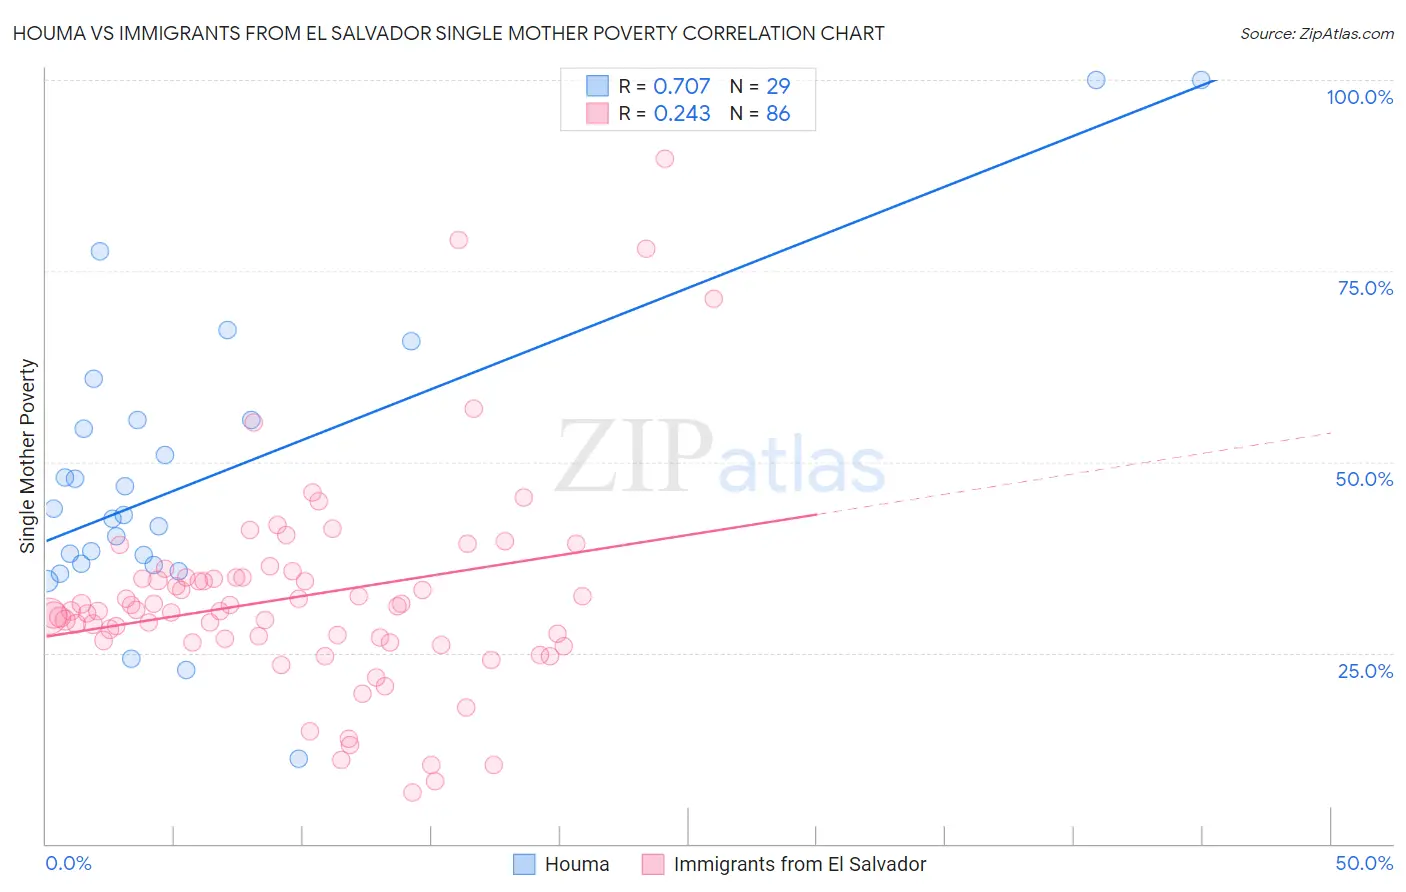
Houma vs Immigrants from El Salvador Single Mother Poverty Correlation Chart
The statistical analysis conducted on geographies consisting of 36,707,466 people shows a strong positive correlation between the proportion of Houma and poverty level among single mothers in the United States with a correlation coefficient (R) of 0.707 and weighted average of 43.5%. Similarly, the statistical analysis conducted on geographies consisting of 352,610,814 people shows a weak positive correlation between the proportion of Immigrants from El Salvador and poverty level among single mothers in the United States with a correlation coefficient (R) of 0.243 and weighted average of 31.2%, a difference of 39.5%.
Single Mother Poverty Correlation Summary
| Measurement | Houma | Immigrants from El Salvador |
| Minimum | 11.1% | 6.7% |
| Maximum | 100.0% | 89.6% |
| Range | 88.9% | 83.0% |
| Mean | 48.0% | 32.4% |
| Median | 43.1% | 30.6% |
| Interquartile 25% (IQ1) | 36.6% | 26.6% |
| Interquartile 75% (IQ3) | 55.5% | 34.8% |
| Interquartile Range (IQR) | 19.0% | 8.2% |
| Standard Deviation (Sample) | 19.9% | 13.9% |
| Standard Deviation (Population) | 19.6% | 13.8% |
Similar Demographics by Single Mother Poverty
Demographics Similar to Houma by Single Mother Poverty
In terms of single mother poverty, the demographic groups most similar to Houma are Lumbee (43.2%, a difference of 0.62%), Tohono O'odham (43.0%, a difference of 1.1%), Puerto Rican (44.5%, a difference of 2.4%), Cajun (40.3%, a difference of 7.9%), and Navajo (40.2%, a difference of 8.2%).
| Demographics | Rating | Rank | Single Mother Poverty |
| Menominee | 0.0 /100 | #333 | Tragic 37.1% |
| Pueblo | 0.0 /100 | #334 | Tragic 37.2% |
| Yuman | 0.0 /100 | #335 | Tragic 37.8% |
| Cheyenne | 0.0 /100 | #336 | Tragic 38.5% |
| Immigrants | Yemen | 0.0 /100 | #337 | Tragic 38.5% |
| Pima | 0.0 /100 | #338 | Tragic 38.6% |
| Crow | 0.0 /100 | #339 | Tragic 38.6% |
| Sioux | 0.0 /100 | #340 | Tragic 38.8% |
| Colville | 0.0 /100 | #341 | Tragic 39.3% |
| Navajo | 0.0 /100 | #342 | Tragic 40.2% |
| Cajuns | 0.0 /100 | #343 | Tragic 40.3% |
| Tohono O'odham | 0.0 /100 | #344 | Tragic 43.0% |
| Lumbee | 0.0 /100 | #345 | Tragic 43.2% |
| Houma | 0.0 /100 | #346 | Tragic 43.5% |
| Puerto Ricans | 0.0 /100 | #347 | Tragic 44.5% |
Demographics Similar to Immigrants from El Salvador by Single Mother Poverty
In terms of single mother poverty, the demographic groups most similar to Immigrants from El Salvador are White/Caucasian (31.2%, a difference of 0.080%), Hmong (31.2%, a difference of 0.14%), Immigrants from Bangladesh (31.1%, a difference of 0.23%), Immigrants from Caribbean (31.1%, a difference of 0.27%), and Immigrants from Bahamas (31.1%, a difference of 0.35%).
| Demographics | Rating | Rank | Single Mother Poverty |
| Senegalese | 0.5 /100 | #254 | Tragic 31.0% |
| Belizeans | 0.5 /100 | #255 | Tragic 31.0% |
| Immigrants | West Indies | 0.4 /100 | #256 | Tragic 31.1% |
| Immigrants | Bahamas | 0.4 /100 | #257 | Tragic 31.1% |
| Immigrants | Caribbean | 0.4 /100 | #258 | Tragic 31.1% |
| Immigrants | Bangladesh | 0.4 /100 | #259 | Tragic 31.1% |
| Whites/Caucasians | 0.3 /100 | #260 | Tragic 31.2% |
| Immigrants | El Salvador | 0.3 /100 | #261 | Tragic 31.2% |
| Hmong | 0.3 /100 | #262 | Tragic 31.2% |
| Bahamians | 0.2 /100 | #263 | Tragic 31.3% |
| Immigrants | Ecuador | 0.2 /100 | #264 | Tragic 31.3% |
| German Russians | 0.2 /100 | #265 | Tragic 31.3% |
| Sub-Saharan Africans | 0.2 /100 | #266 | Tragic 31.4% |
| Immigrants | Belize | 0.2 /100 | #267 | Tragic 31.4% |
| Immigrants | Senegal | 0.1 /100 | #268 | Tragic 31.5% |