Houma vs Immigrants from Europe Single Mother Poverty
COMPARE
Houma
Immigrants from Europe
Single Mother Poverty
Single Mother Poverty Comparison
Houma
Immigrants from Europe
43.5%
SINGLE MOTHER POVERTY
0.0/ 100
METRIC RATING
346th/ 347
METRIC RANK
27.4%
SINGLE MOTHER POVERTY
99.3/ 100
METRIC RATING
74th/ 347
METRIC RANK
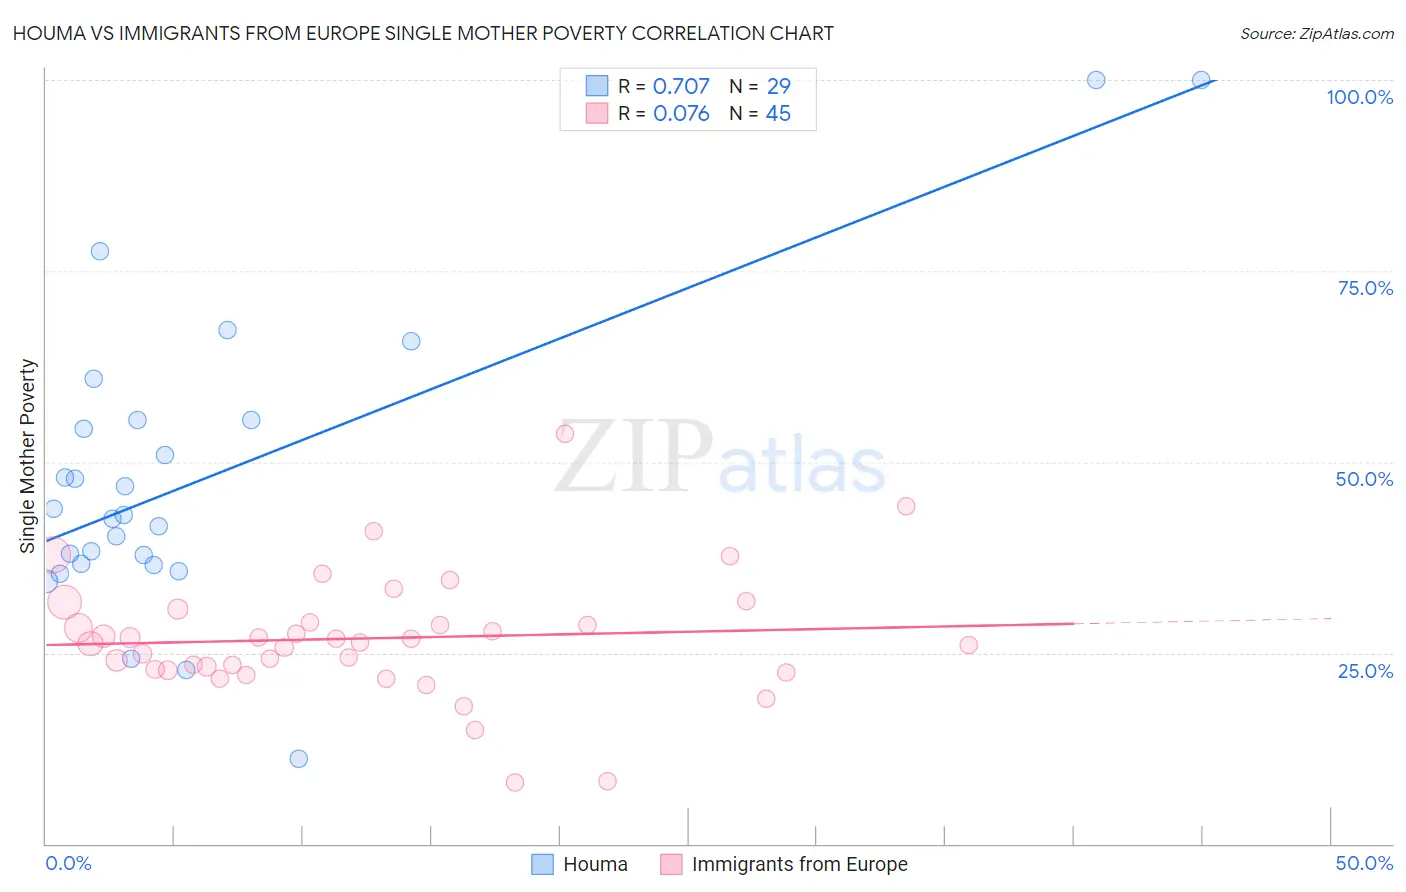
Houma vs Immigrants from Europe Single Mother Poverty Correlation Chart
The statistical analysis conducted on geographies consisting of 36,707,466 people shows a strong positive correlation between the proportion of Houma and poverty level among single mothers in the United States with a correlation coefficient (R) of 0.707 and weighted average of 43.5%. Similarly, the statistical analysis conducted on geographies consisting of 523,370,699 people shows a slight positive correlation between the proportion of Immigrants from Europe and poverty level among single mothers in the United States with a correlation coefficient (R) of 0.076 and weighted average of 27.4%, a difference of 58.6%.
Single Mother Poverty Correlation Summary
| Measurement | Houma | Immigrants from Europe |
| Minimum | 11.1% | 8.0% |
| Maximum | 100.0% | 53.7% |
| Range | 88.9% | 45.6% |
| Mean | 48.0% | 26.9% |
| Median | 43.1% | 26.4% |
| Interquartile 25% (IQ1) | 36.6% | 22.8% |
| Interquartile 75% (IQ3) | 55.5% | 29.9% |
| Interquartile Range (IQR) | 19.0% | 7.1% |
| Standard Deviation (Sample) | 19.9% | 8.2% |
| Standard Deviation (Population) | 19.6% | 8.1% |
Similar Demographics by Single Mother Poverty
Demographics Similar to Houma by Single Mother Poverty
In terms of single mother poverty, the demographic groups most similar to Houma are Lumbee (43.2%, a difference of 0.62%), Tohono O'odham (43.0%, a difference of 1.1%), Puerto Rican (44.5%, a difference of 2.4%), Cajun (40.3%, a difference of 7.9%), and Navajo (40.2%, a difference of 8.2%).
| Demographics | Rating | Rank | Single Mother Poverty |
| Menominee | 0.0 /100 | #333 | Tragic 37.1% |
| Pueblo | 0.0 /100 | #334 | Tragic 37.2% |
| Yuman | 0.0 /100 | #335 | Tragic 37.8% |
| Cheyenne | 0.0 /100 | #336 | Tragic 38.5% |
| Immigrants | Yemen | 0.0 /100 | #337 | Tragic 38.5% |
| Pima | 0.0 /100 | #338 | Tragic 38.6% |
| Crow | 0.0 /100 | #339 | Tragic 38.6% |
| Sioux | 0.0 /100 | #340 | Tragic 38.8% |
| Colville | 0.0 /100 | #341 | Tragic 39.3% |
| Navajo | 0.0 /100 | #342 | Tragic 40.2% |
| Cajuns | 0.0 /100 | #343 | Tragic 40.3% |
| Tohono O'odham | 0.0 /100 | #344 | Tragic 43.0% |
| Lumbee | 0.0 /100 | #345 | Tragic 43.2% |
| Houma | 0.0 /100 | #346 | Tragic 43.5% |
| Puerto Ricans | 0.0 /100 | #347 | Tragic 44.5% |
Demographics Similar to Immigrants from Europe by Single Mother Poverty
In terms of single mother poverty, the demographic groups most similar to Immigrants from Europe are Sierra Leonean (27.4%, a difference of 0.060%), Immigrants from Russia (27.4%, a difference of 0.13%), Immigrants from Sweden (27.5%, a difference of 0.13%), Macedonian (27.4%, a difference of 0.15%), and Immigrants from Belarus (27.4%, a difference of 0.17%).
| Demographics | Rating | Rank | Single Mother Poverty |
| Immigrants | Australia | 99.5 /100 | #67 | Exceptional 27.3% |
| Immigrants | Czechoslovakia | 99.5 /100 | #68 | Exceptional 27.4% |
| Lithuanians | 99.4 /100 | #69 | Exceptional 27.4% |
| Immigrants | Belarus | 99.4 /100 | #70 | Exceptional 27.4% |
| Macedonians | 99.4 /100 | #71 | Exceptional 27.4% |
| Immigrants | Russia | 99.4 /100 | #72 | Exceptional 27.4% |
| Sierra Leoneans | 99.3 /100 | #73 | Exceptional 27.4% |
| Immigrants | Europe | 99.3 /100 | #74 | Exceptional 27.4% |
| Immigrants | Sweden | 99.2 /100 | #75 | Exceptional 27.5% |
| Peruvians | 99.2 /100 | #76 | Exceptional 27.5% |
| Immigrants | Peru | 99.2 /100 | #77 | Exceptional 27.5% |
| Immigrants | North Macedonia | 99.2 /100 | #78 | Exceptional 27.5% |
| Immigrants | Italy | 99.1 /100 | #79 | Exceptional 27.5% |
| Taiwanese | 99.1 /100 | #80 | Exceptional 27.5% |
| Immigrants | Scotland | 98.9 /100 | #81 | Exceptional 27.6% |