Houma vs New Zealander Ambulatory Disability
COMPARE
Houma
New Zealander
Ambulatory Disability
Ambulatory Disability Comparison
Houma
New Zealanders
9.3%
AMBULATORY DISABILITY
0.0/ 100
METRIC RATING
346th/ 347
METRIC RANK
5.8%
AMBULATORY DISABILITY
97.6/ 100
METRIC RATING
104th/ 347
METRIC RANK
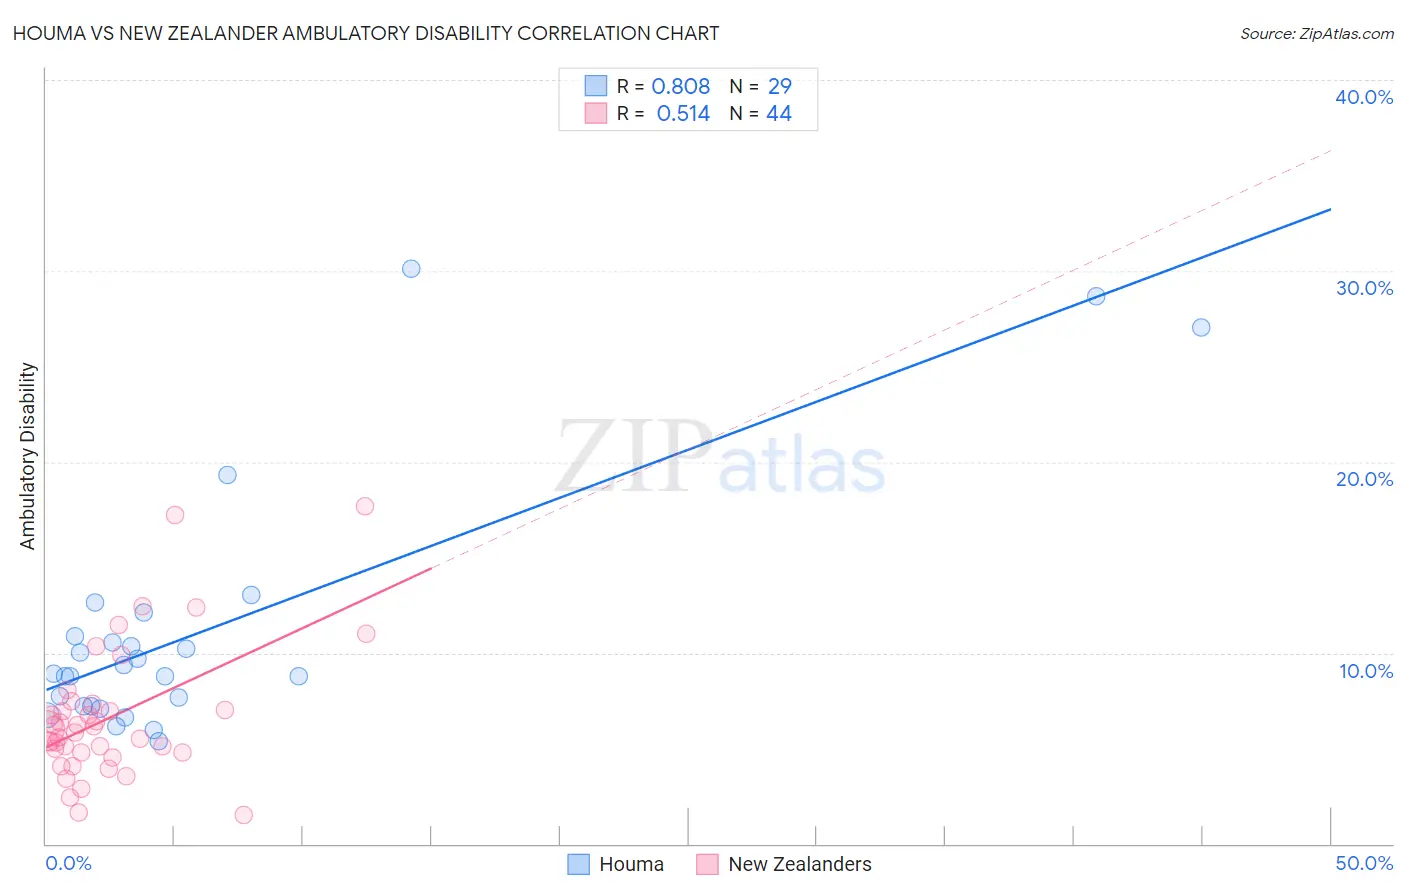
Houma vs New Zealander Ambulatory Disability Correlation Chart
The statistical analysis conducted on geographies consisting of 36,798,241 people shows a very strong positive correlation between the proportion of Houma and percentage of population with ambulatory disability in the United States with a correlation coefficient (R) of 0.808 and weighted average of 9.3%. Similarly, the statistical analysis conducted on geographies consisting of 106,904,660 people shows a substantial positive correlation between the proportion of New Zealanders and percentage of population with ambulatory disability in the United States with a correlation coefficient (R) of 0.514 and weighted average of 5.8%, a difference of 60.0%.
Ambulatory Disability Correlation Summary
| Measurement | Houma | New Zealander |
| Minimum | 5.4% | 1.5% |
| Maximum | 30.1% | 17.7% |
| Range | 24.8% | 16.2% |
| Mean | 11.2% | 6.6% |
| Median | 8.9% | 5.9% |
| Interquartile 25% (IQ1) | 7.2% | 4.8% |
| Interquartile 75% (IQ3) | 11.5% | 7.2% |
| Interquartile Range (IQR) | 4.3% | 2.4% |
| Standard Deviation (Sample) | 6.6% | 3.5% |
| Standard Deviation (Population) | 6.5% | 3.4% |
Similar Demographics by Ambulatory Disability
Demographics Similar to Houma by Ambulatory Disability
In terms of ambulatory disability, the demographic groups most similar to Houma are Lumbee (9.5%, a difference of 2.5%), Puerto Rican (8.9%, a difference of 4.9%), Tsimshian (8.8%, a difference of 5.5%), Tohono O'odham (8.7%, a difference of 6.5%), and Kiowa (8.6%, a difference of 8.1%).
| Demographics | Rating | Rank | Ambulatory Disability |
| Cherokee | 0.0 /100 | #333 | Tragic 7.9% |
| Yuman | 0.0 /100 | #334 | Tragic 7.9% |
| Chickasaw | 0.0 /100 | #335 | Tragic 8.0% |
| Seminole | 0.0 /100 | #336 | Tragic 8.0% |
| Dutch West Indians | 0.0 /100 | #337 | Tragic 8.2% |
| Colville | 0.0 /100 | #338 | Tragic 8.2% |
| Pima | 0.0 /100 | #339 | Tragic 8.2% |
| Choctaw | 0.0 /100 | #340 | Tragic 8.3% |
| Creek | 0.0 /100 | #341 | Tragic 8.5% |
| Kiowa | 0.0 /100 | #342 | Tragic 8.6% |
| Tohono O'odham | 0.0 /100 | #343 | Tragic 8.7% |
| Tsimshian | 0.0 /100 | #344 | Tragic 8.8% |
| Puerto Ricans | 0.0 /100 | #345 | Tragic 8.9% |
| Houma | 0.0 /100 | #346 | Tragic 9.3% |
| Lumbee | 0.0 /100 | #347 | Tragic 9.5% |
Demographics Similar to New Zealanders by Ambulatory Disability
In terms of ambulatory disability, the demographic groups most similar to New Zealanders are Immigrants from Romania (5.8%, a difference of 0.060%), Immigrants from Czechoslovakia (5.8%, a difference of 0.11%), Immigrants from Kenya (5.8%, a difference of 0.13%), Immigrants from Morocco (5.8%, a difference of 0.18%), and Immigrants from Serbia (5.8%, a difference of 0.21%).
| Demographics | Rating | Rank | Ambulatory Disability |
| Immigrants | Somalia | 98.3 /100 | #97 | Exceptional 5.8% |
| Immigrants | Lebanon | 98.3 /100 | #98 | Exceptional 5.8% |
| Immigrants | Northern Europe | 98.2 /100 | #99 | Exceptional 5.8% |
| Immigrants | Serbia | 97.9 /100 | #100 | Exceptional 5.8% |
| Immigrants | South America | 97.9 /100 | #101 | Exceptional 5.8% |
| Immigrants | Kenya | 97.8 /100 | #102 | Exceptional 5.8% |
| Immigrants | Romania | 97.7 /100 | #103 | Exceptional 5.8% |
| New Zealanders | 97.6 /100 | #104 | Exceptional 5.8% |
| Immigrants | Czechoslovakia | 97.4 /100 | #105 | Exceptional 5.8% |
| Immigrants | Morocco | 97.3 /100 | #106 | Exceptional 5.8% |
| Uruguayans | 97.2 /100 | #107 | Exceptional 5.8% |
| Colombians | 97.2 /100 | #108 | Exceptional 5.8% |
| Immigrants | Netherlands | 97.1 /100 | #109 | Exceptional 5.8% |
| Immigrants | Colombia | 96.7 /100 | #110 | Exceptional 5.8% |
| Danes | 96.6 /100 | #111 | Exceptional 5.8% |