Houma vs Sudanese Single Mother Poverty
COMPARE
Houma
Sudanese
Single Mother Poverty
Single Mother Poverty Comparison
Houma
Sudanese
43.5%
SINGLE MOTHER POVERTY
0.0/ 100
METRIC RATING
346th/ 347
METRIC RANK
30.0%
SINGLE MOTHER POVERTY
7.6/ 100
METRIC RATING
222nd/ 347
METRIC RANK
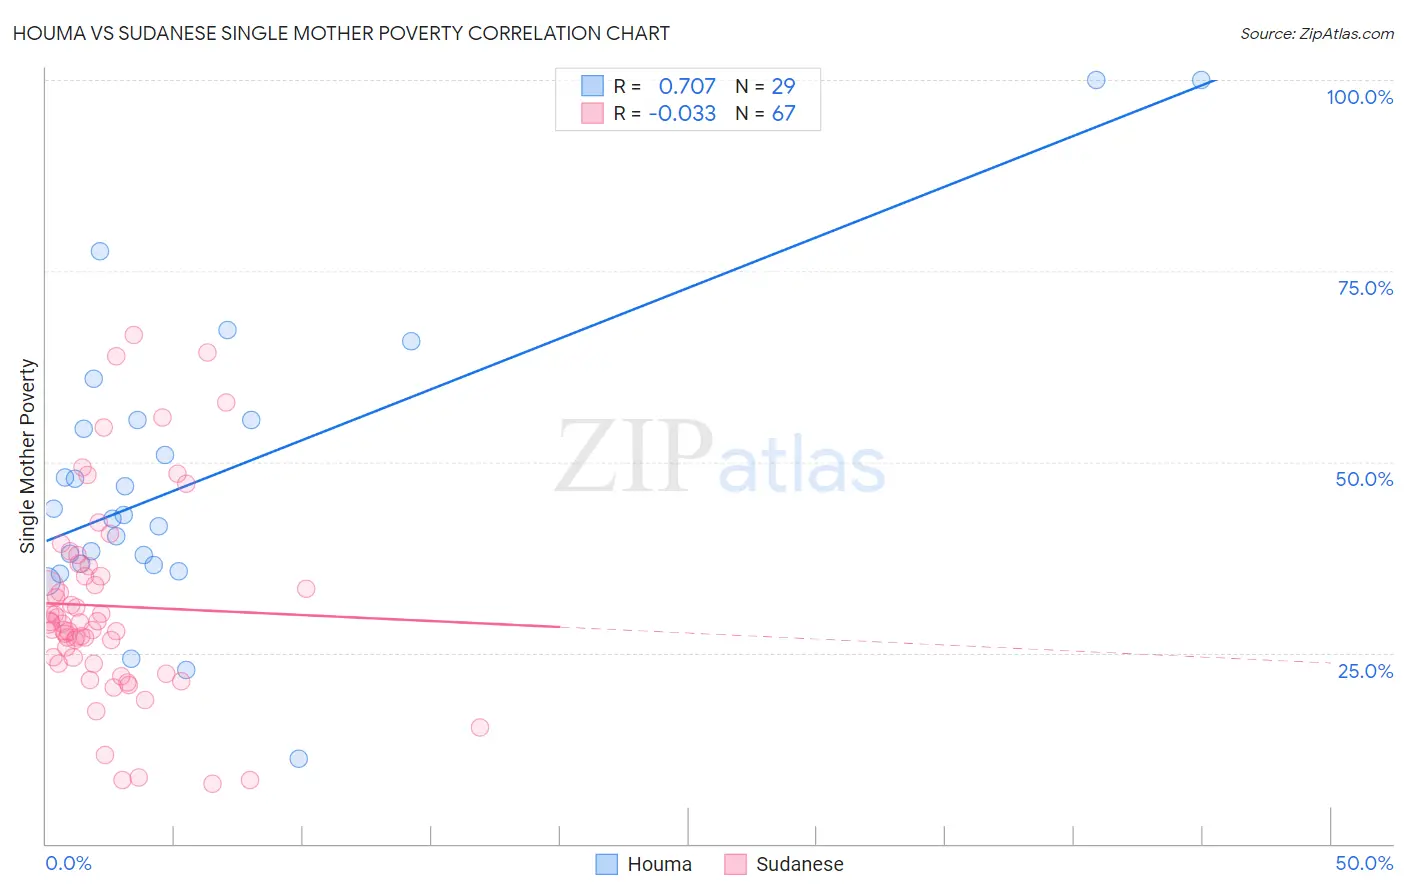
Houma vs Sudanese Single Mother Poverty Correlation Chart
The statistical analysis conducted on geographies consisting of 36,707,466 people shows a strong positive correlation between the proportion of Houma and poverty level among single mothers in the United States with a correlation coefficient (R) of 0.707 and weighted average of 43.5%. Similarly, the statistical analysis conducted on geographies consisting of 109,550,983 people shows no correlation between the proportion of Sudanese and poverty level among single mothers in the United States with a correlation coefficient (R) of -0.033 and weighted average of 30.0%, a difference of 44.9%.
Single Mother Poverty Correlation Summary
| Measurement | Houma | Sudanese |
| Minimum | 11.1% | 7.9% |
| Maximum | 100.0% | 66.7% |
| Range | 88.9% | 58.8% |
| Mean | 48.0% | 31.1% |
| Median | 43.1% | 28.9% |
| Interquartile 25% (IQ1) | 36.6% | 23.6% |
| Interquartile 75% (IQ3) | 55.5% | 36.3% |
| Interquartile Range (IQR) | 19.0% | 12.7% |
| Standard Deviation (Sample) | 19.9% | 13.0% |
| Standard Deviation (Population) | 19.6% | 12.9% |
Similar Demographics by Single Mother Poverty
Demographics Similar to Houma by Single Mother Poverty
In terms of single mother poverty, the demographic groups most similar to Houma are Lumbee (43.2%, a difference of 0.62%), Tohono O'odham (43.0%, a difference of 1.1%), Puerto Rican (44.5%, a difference of 2.4%), Cajun (40.3%, a difference of 7.9%), and Navajo (40.2%, a difference of 8.2%).
| Demographics | Rating | Rank | Single Mother Poverty |
| Menominee | 0.0 /100 | #333 | Tragic 37.1% |
| Pueblo | 0.0 /100 | #334 | Tragic 37.2% |
| Yuman | 0.0 /100 | #335 | Tragic 37.8% |
| Cheyenne | 0.0 /100 | #336 | Tragic 38.5% |
| Immigrants | Yemen | 0.0 /100 | #337 | Tragic 38.5% |
| Pima | 0.0 /100 | #338 | Tragic 38.6% |
| Crow | 0.0 /100 | #339 | Tragic 38.6% |
| Sioux | 0.0 /100 | #340 | Tragic 38.8% |
| Colville | 0.0 /100 | #341 | Tragic 39.3% |
| Navajo | 0.0 /100 | #342 | Tragic 40.2% |
| Cajuns | 0.0 /100 | #343 | Tragic 40.3% |
| Tohono O'odham | 0.0 /100 | #344 | Tragic 43.0% |
| Lumbee | 0.0 /100 | #345 | Tragic 43.2% |
| Houma | 0.0 /100 | #346 | Tragic 43.5% |
| Puerto Ricans | 0.0 /100 | #347 | Tragic 44.5% |
Demographics Similar to Sudanese by Single Mother Poverty
In terms of single mother poverty, the demographic groups most similar to Sudanese are Immigrants from Eritrea (30.0%, a difference of 0.010%), Immigrants from Cuba (30.1%, a difference of 0.13%), German (30.0%, a difference of 0.18%), Immigrants from Sudan (30.1%, a difference of 0.20%), and Spanish (30.1%, a difference of 0.23%).
| Demographics | Rating | Rank | Single Mother Poverty |
| Jamaicans | 11.7 /100 | #215 | Poor 29.9% |
| Immigrants | Western Africa | 11.5 /100 | #216 | Poor 29.9% |
| Immigrants | Ghana | 11.3 /100 | #217 | Poor 29.9% |
| Hungarians | 10.3 /100 | #218 | Poor 29.9% |
| Finns | 9.3 /100 | #219 | Tragic 30.0% |
| Germans | 8.8 /100 | #220 | Tragic 30.0% |
| Immigrants | Eritrea | 7.7 /100 | #221 | Tragic 30.0% |
| Sudanese | 7.6 /100 | #222 | Tragic 30.0% |
| Immigrants | Cuba | 6.9 /100 | #223 | Tragic 30.1% |
| Immigrants | Sudan | 6.5 /100 | #224 | Tragic 30.1% |
| Spanish | 6.3 /100 | #225 | Tragic 30.1% |
| Scottish | 6.0 /100 | #226 | Tragic 30.1% |
| Immigrants | Liberia | 5.9 /100 | #227 | Tragic 30.1% |
| Spaniards | 5.4 /100 | #228 | Tragic 30.2% |
| Immigrants | Barbados | 5.0 /100 | #229 | Tragic 30.2% |