Houma vs Central American Single Mother Poverty
COMPARE
Houma
Central American
Single Mother Poverty
Single Mother Poverty Comparison
Houma
Central Americans
43.5%
SINGLE MOTHER POVERTY
0.0/ 100
METRIC RATING
346th/ 347
METRIC RANK
31.8%
SINGLE MOTHER POVERTY
0.1/ 100
METRIC RATING
275th/ 347
METRIC RANK
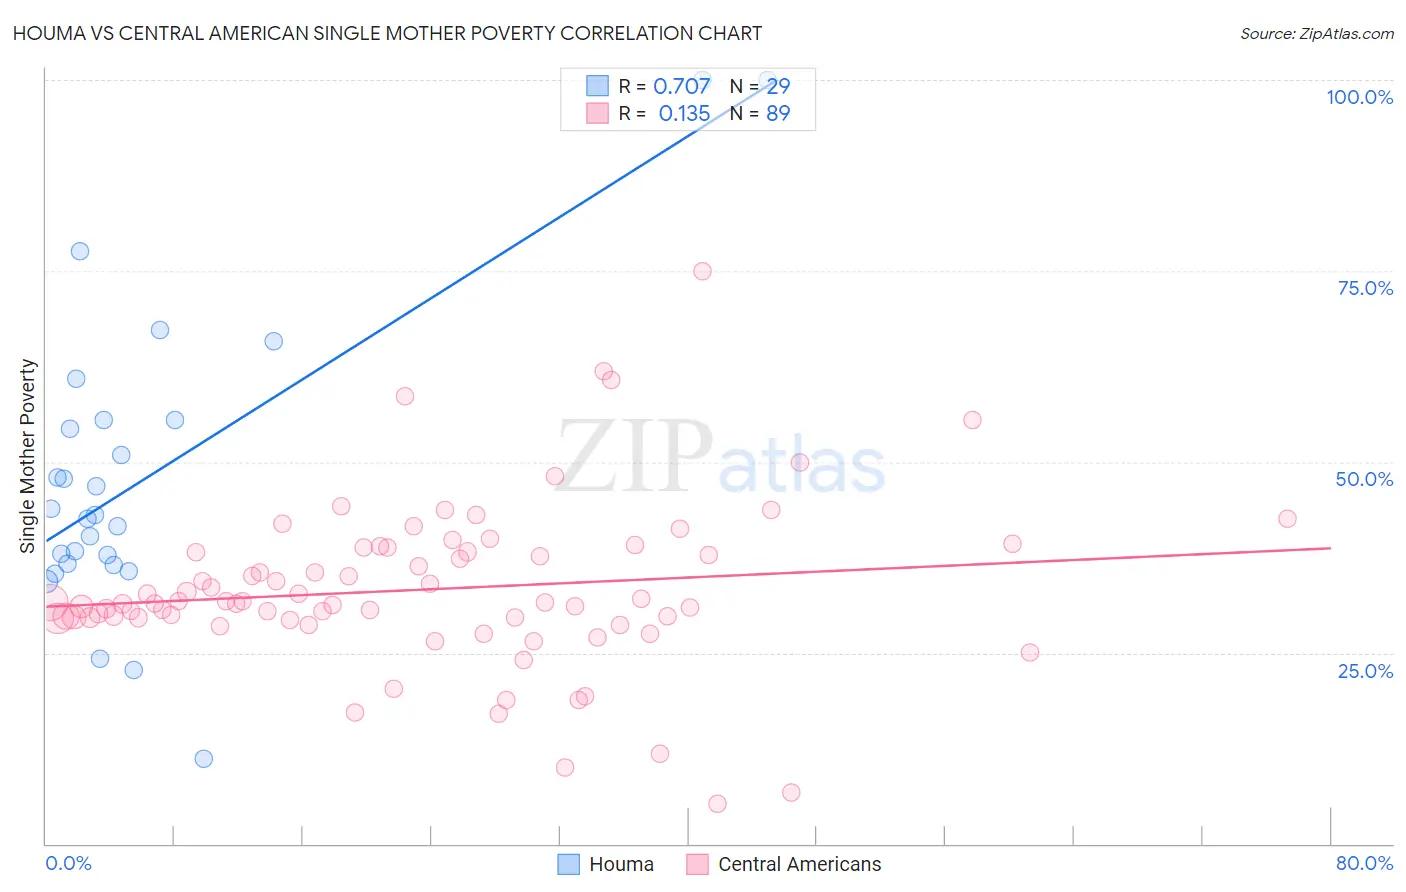
Houma vs Central American Single Mother Poverty Correlation Chart
The statistical analysis conducted on geographies consisting of 36,707,466 people shows a strong positive correlation between the proportion of Houma and poverty level among single mothers in the United States with a correlation coefficient (R) of 0.707 and weighted average of 43.5%. Similarly, the statistical analysis conducted on geographies consisting of 489,410,238 people shows a poor positive correlation between the proportion of Central Americans and poverty level among single mothers in the United States with a correlation coefficient (R) of 0.135 and weighted average of 31.8%, a difference of 36.9%.
Single Mother Poverty Correlation Summary
| Measurement | Houma | Central American |
| Minimum | 11.1% | 5.3% |
| Maximum | 100.0% | 75.0% |
| Range | 88.9% | 69.8% |
| Mean | 48.0% | 33.3% |
| Median | 43.1% | 31.5% |
| Interquartile 25% (IQ1) | 36.6% | 29.5% |
| Interquartile 75% (IQ3) | 55.5% | 38.5% |
| Interquartile Range (IQR) | 19.0% | 8.9% |
| Standard Deviation (Sample) | 19.9% | 10.9% |
| Standard Deviation (Population) | 19.6% | 10.9% |
Similar Demographics by Single Mother Poverty
Demographics Similar to Houma by Single Mother Poverty
In terms of single mother poverty, the demographic groups most similar to Houma are Lumbee (43.2%, a difference of 0.62%), Tohono O'odham (43.0%, a difference of 1.1%), Puerto Rican (44.5%, a difference of 2.4%), Cajun (40.3%, a difference of 7.9%), and Navajo (40.2%, a difference of 8.2%).
| Demographics | Rating | Rank | Single Mother Poverty |
| Menominee | 0.0 /100 | #333 | Tragic 37.1% |
| Pueblo | 0.0 /100 | #334 | Tragic 37.2% |
| Yuman | 0.0 /100 | #335 | Tragic 37.8% |
| Cheyenne | 0.0 /100 | #336 | Tragic 38.5% |
| Immigrants | Yemen | 0.0 /100 | #337 | Tragic 38.5% |
| Pima | 0.0 /100 | #338 | Tragic 38.6% |
| Crow | 0.0 /100 | #339 | Tragic 38.6% |
| Sioux | 0.0 /100 | #340 | Tragic 38.8% |
| Colville | 0.0 /100 | #341 | Tragic 39.3% |
| Navajo | 0.0 /100 | #342 | Tragic 40.2% |
| Cajuns | 0.0 /100 | #343 | Tragic 40.3% |
| Tohono O'odham | 0.0 /100 | #344 | Tragic 43.0% |
| Lumbee | 0.0 /100 | #345 | Tragic 43.2% |
| Houma | 0.0 /100 | #346 | Tragic 43.5% |
| Puerto Ricans | 0.0 /100 | #347 | Tragic 44.5% |
Demographics Similar to Central Americans by Single Mother Poverty
In terms of single mother poverty, the demographic groups most similar to Central Americans are Delaware (31.8%, a difference of 0.16%), Bangladeshi (31.7%, a difference of 0.19%), Mexican American Indian (31.9%, a difference of 0.37%), Fijian (31.6%, a difference of 0.42%), and Immigrants from Zaire (32.0%, a difference of 0.60%).
| Demographics | Rating | Rank | Single Mother Poverty |
| Immigrants | Senegal | 0.1 /100 | #268 | Tragic 31.5% |
| Scotch-Irish | 0.1 /100 | #269 | Tragic 31.5% |
| British West Indians | 0.1 /100 | #270 | Tragic 31.5% |
| Immigrants | Cabo Verde | 0.1 /100 | #271 | Tragic 31.6% |
| Immigrants | Micronesia | 0.1 /100 | #272 | Tragic 31.6% |
| Fijians | 0.1 /100 | #273 | Tragic 31.6% |
| Bangladeshis | 0.1 /100 | #274 | Tragic 31.7% |
| Central Americans | 0.1 /100 | #275 | Tragic 31.8% |
| Delaware | 0.0 /100 | #276 | Tragic 31.8% |
| Mexican American Indians | 0.0 /100 | #277 | Tragic 31.9% |
| Immigrants | Zaire | 0.0 /100 | #278 | Tragic 32.0% |
| Marshallese | 0.0 /100 | #279 | Tragic 32.1% |
| Immigrants | Nonimmigrants | 0.0 /100 | #280 | Tragic 32.2% |
| Cree | 0.0 /100 | #281 | Tragic 32.2% |
| Immigrants | Azores | 0.0 /100 | #282 | Tragic 32.2% |