Houma vs Immigrants from China Single Mother Poverty
COMPARE
Houma
Immigrants from China
Single Mother Poverty
Single Mother Poverty Comparison
Houma
Immigrants from China
43.5%
SINGLE MOTHER POVERTY
0.0/ 100
METRIC RATING
346th/ 347
METRIC RANK
26.1%
SINGLE MOTHER POVERTY
100.0/ 100
METRIC RATING
20th/ 347
METRIC RANK
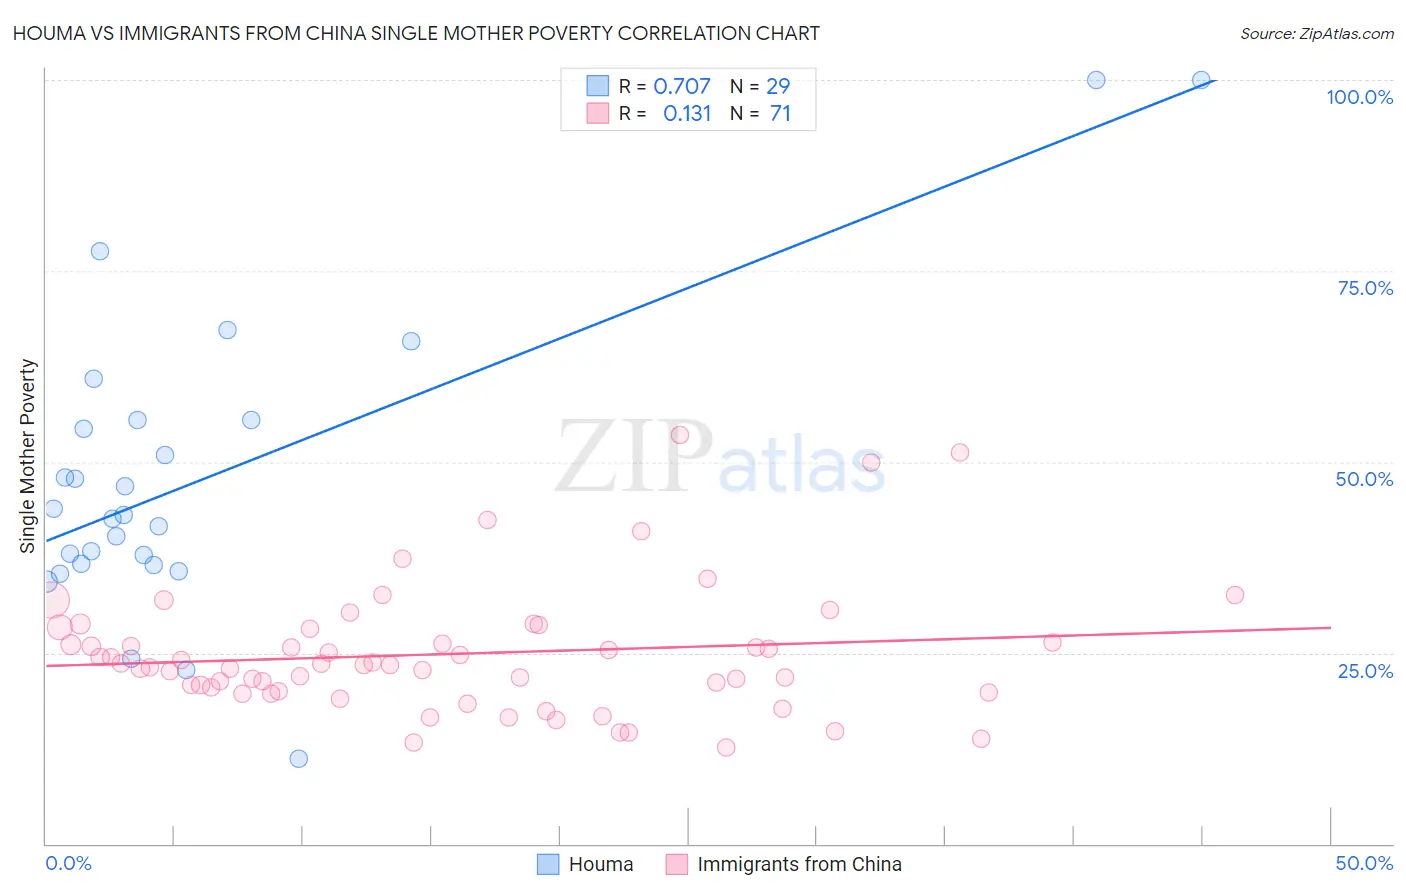
Houma vs Immigrants from China Single Mother Poverty Correlation Chart
The statistical analysis conducted on geographies consisting of 36,707,466 people shows a strong positive correlation between the proportion of Houma and poverty level among single mothers in the United States with a correlation coefficient (R) of 0.707 and weighted average of 43.5%. Similarly, the statistical analysis conducted on geographies consisting of 441,985,494 people shows a poor positive correlation between the proportion of Immigrants from China and poverty level among single mothers in the United States with a correlation coefficient (R) of 0.131 and weighted average of 26.1%, a difference of 66.7%.
Single Mother Poverty Correlation Summary
| Measurement | Houma | Immigrants from China |
| Minimum | 11.1% | 12.6% |
| Maximum | 100.0% | 53.5% |
| Range | 88.9% | 41.0% |
| Mean | 48.0% | 24.9% |
| Median | 43.1% | 23.4% |
| Interquartile 25% (IQ1) | 36.6% | 20.0% |
| Interquartile 75% (IQ3) | 55.5% | 28.2% |
| Interquartile Range (IQR) | 19.0% | 8.2% |
| Standard Deviation (Sample) | 19.9% | 8.3% |
| Standard Deviation (Population) | 19.6% | 8.2% |
Similar Demographics by Single Mother Poverty
Demographics Similar to Houma by Single Mother Poverty
In terms of single mother poverty, the demographic groups most similar to Houma are Lumbee (43.2%, a difference of 0.62%), Tohono O'odham (43.0%, a difference of 1.1%), Puerto Rican (44.5%, a difference of 2.4%), Cajun (40.3%, a difference of 7.9%), and Navajo (40.2%, a difference of 8.2%).
| Demographics | Rating | Rank | Single Mother Poverty |
| Menominee | 0.0 /100 | #333 | Tragic 37.1% |
| Pueblo | 0.0 /100 | #334 | Tragic 37.2% |
| Yuman | 0.0 /100 | #335 | Tragic 37.8% |
| Cheyenne | 0.0 /100 | #336 | Tragic 38.5% |
| Immigrants | Yemen | 0.0 /100 | #337 | Tragic 38.5% |
| Pima | 0.0 /100 | #338 | Tragic 38.6% |
| Crow | 0.0 /100 | #339 | Tragic 38.6% |
| Sioux | 0.0 /100 | #340 | Tragic 38.8% |
| Colville | 0.0 /100 | #341 | Tragic 39.3% |
| Navajo | 0.0 /100 | #342 | Tragic 40.2% |
| Cajuns | 0.0 /100 | #343 | Tragic 40.3% |
| Tohono O'odham | 0.0 /100 | #344 | Tragic 43.0% |
| Lumbee | 0.0 /100 | #345 | Tragic 43.2% |
| Houma | 0.0 /100 | #346 | Tragic 43.5% |
| Puerto Ricans | 0.0 /100 | #347 | Tragic 44.5% |
Demographics Similar to Immigrants from China by Single Mother Poverty
In terms of single mother poverty, the demographic groups most similar to Immigrants from China are Immigrants from Eastern Asia (26.1%, a difference of 0.13%), Immigrants from Bolivia (26.2%, a difference of 0.19%), Immigrants from Pakistan (26.0%, a difference of 0.27%), Immigrants from Korea (26.2%, a difference of 0.36%), and Burmese (26.2%, a difference of 0.54%).
| Demographics | Rating | Rank | Single Mother Poverty |
| Indians (Asian) | 100.0 /100 | #13 | Exceptional 25.8% |
| Immigrants | Singapore | 100.0 /100 | #14 | Exceptional 25.8% |
| Immigrants | Ireland | 100.0 /100 | #15 | Exceptional 25.8% |
| Bolivians | 100.0 /100 | #16 | Exceptional 25.9% |
| Asians | 100.0 /100 | #17 | Exceptional 26.0% |
| Immigrants | Pakistan | 100.0 /100 | #18 | Exceptional 26.0% |
| Immigrants | Eastern Asia | 100.0 /100 | #19 | Exceptional 26.1% |
| Immigrants | China | 100.0 /100 | #20 | Exceptional 26.1% |
| Immigrants | Bolivia | 100.0 /100 | #21 | Exceptional 26.2% |
| Immigrants | Korea | 100.0 /100 | #22 | Exceptional 26.2% |
| Burmese | 100.0 /100 | #23 | Exceptional 26.2% |
| Immigrants | Moldova | 100.0 /100 | #24 | Exceptional 26.2% |
| Immigrants | Asia | 100.0 /100 | #25 | Exceptional 26.3% |
| Immigrants | Sri Lanka | 100.0 /100 | #26 | Exceptional 26.3% |
| Immigrants | Japan | 100.0 /100 | #27 | Exceptional 26.4% |