Estonian vs New Zealander Single Mother Poverty
COMPARE
Estonian
New Zealander
Single Mother Poverty
Single Mother Poverty Comparison
Estonians
New Zealanders
27.8%
SINGLE MOTHER POVERTY
97.9/ 100
METRIC RATING
92nd/ 347
METRIC RANK
29.1%
SINGLE MOTHER POVERTY
55.1/ 100
METRIC RATING
170th/ 347
METRIC RANK
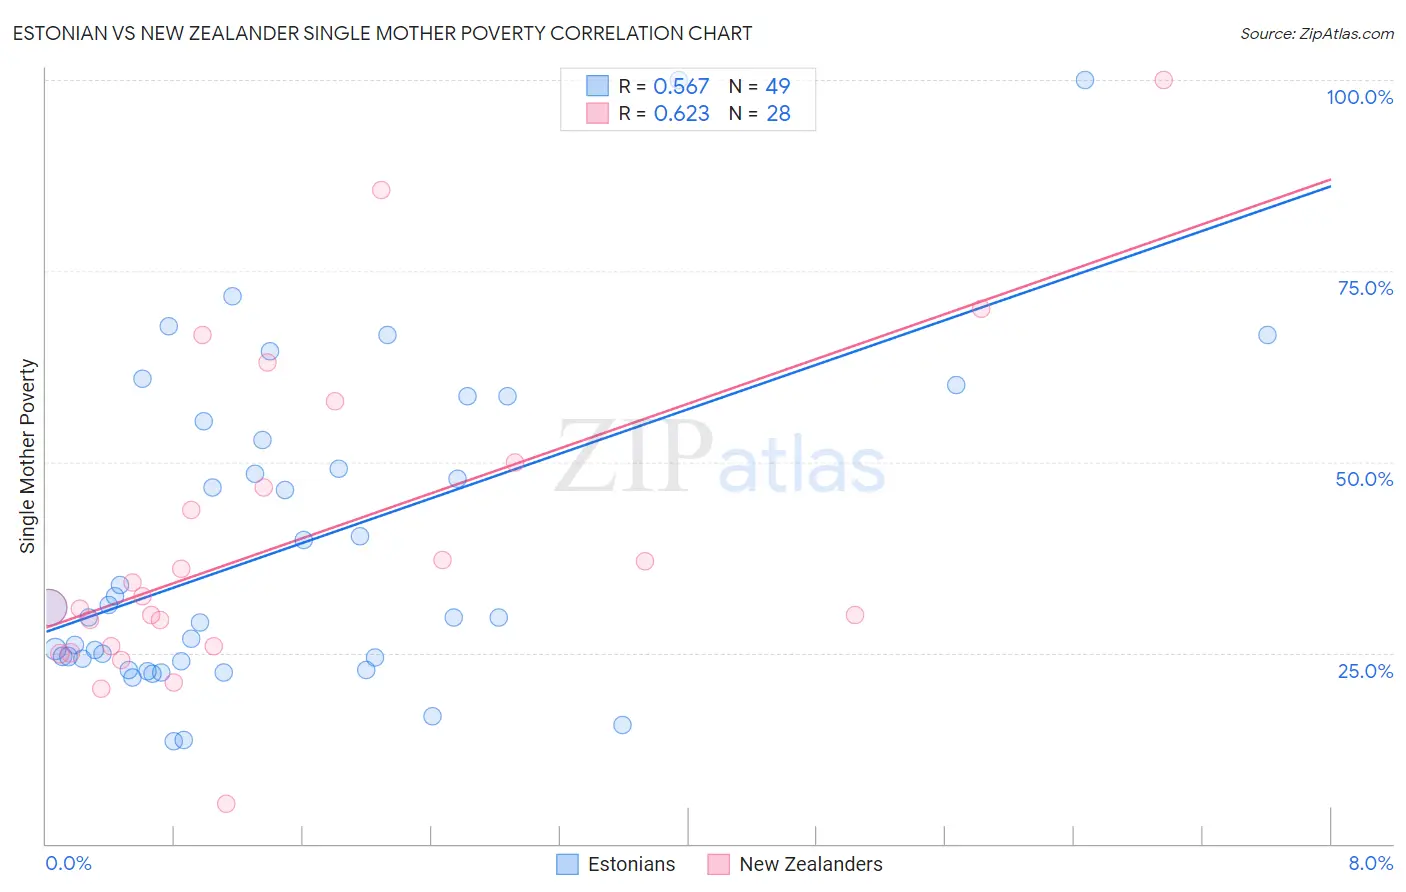
Estonian vs New Zealander Single Mother Poverty Correlation Chart
The statistical analysis conducted on geographies consisting of 121,617,183 people shows a substantial positive correlation between the proportion of Estonians and poverty level among single mothers in the United States with a correlation coefficient (R) of 0.567 and weighted average of 27.8%. Similarly, the statistical analysis conducted on geographies consisting of 105,692,978 people shows a significant positive correlation between the proportion of New Zealanders and poverty level among single mothers in the United States with a correlation coefficient (R) of 0.623 and weighted average of 29.1%, a difference of 4.6%.
Single Mother Poverty Correlation Summary
| Measurement | Estonian | New Zealander |
| Minimum | 13.5% | 5.3% |
| Maximum | 100.0% | 100.0% |
| Range | 86.5% | 94.7% |
| Mean | 39.1% | 39.7% |
| Median | 29.6% | 31.7% |
| Interquartile 25% (IQ1) | 24.1% | 25.9% |
| Interquartile 75% (IQ3) | 54.1% | 48.3% |
| Interquartile Range (IQR) | 30.0% | 22.4% |
| Standard Deviation (Sample) | 20.8% | 21.1% |
| Standard Deviation (Population) | 20.6% | 20.8% |
Similar Demographics by Single Mother Poverty
Demographics Similar to Estonians by Single Mother Poverty
In terms of single mother poverty, the demographic groups most similar to Estonians are Immigrants from Albania (27.8%, a difference of 0.030%), Romanian (27.8%, a difference of 0.10%), Immigrants from France (27.8%, a difference of 0.17%), Albanian (27.9%, a difference of 0.19%), and Chilean (27.9%, a difference of 0.22%).
| Demographics | Rating | Rank | Single Mother Poverty |
| Mongolians | 98.7 /100 | #85 | Exceptional 27.7% |
| Immigrants | Ukraine | 98.6 /100 | #86 | Exceptional 27.7% |
| Afghans | 98.5 /100 | #87 | Exceptional 27.7% |
| Ethiopians | 98.4 /100 | #88 | Exceptional 27.7% |
| Immigrants | Ethiopia | 98.4 /100 | #89 | Exceptional 27.7% |
| Immigrants | France | 98.2 /100 | #90 | Exceptional 27.8% |
| Immigrants | Albania | 98.0 /100 | #91 | Exceptional 27.8% |
| Estonians | 97.9 /100 | #92 | Exceptional 27.8% |
| Romanians | 97.8 /100 | #93 | Exceptional 27.8% |
| Albanians | 97.6 /100 | #94 | Exceptional 27.9% |
| Chileans | 97.5 /100 | #95 | Exceptional 27.9% |
| Immigrants | Iraq | 97.3 /100 | #96 | Exceptional 27.9% |
| Immigrants | Brazil | 97.2 /100 | #97 | Exceptional 27.9% |
| Immigrants | Nepal | 97.2 /100 | #98 | Exceptional 27.9% |
| Immigrants | Netherlands | 97.2 /100 | #99 | Exceptional 27.9% |
Demographics Similar to New Zealanders by Single Mother Poverty
In terms of single mother poverty, the demographic groups most similar to New Zealanders are Puget Sound Salish (29.1%, a difference of 0.0%), Carpatho Rusyn (29.1%, a difference of 0.060%), Immigrants from Uruguay (29.1%, a difference of 0.10%), European (29.1%, a difference of 0.12%), and Costa Rican (29.0%, a difference of 0.16%).
| Demographics | Rating | Rank | Single Mother Poverty |
| Immigrants | Nigeria | 65.9 /100 | #163 | Good 28.9% |
| Immigrants | Kenya | 65.9 /100 | #164 | Good 28.9% |
| Arabs | 60.7 /100 | #165 | Good 29.0% |
| Inupiat | 60.4 /100 | #166 | Good 29.0% |
| Costa Ricans | 58.4 /100 | #167 | Average 29.0% |
| Europeans | 57.6 /100 | #168 | Average 29.1% |
| Immigrants | Uruguay | 57.2 /100 | #169 | Average 29.1% |
| New Zealanders | 55.1 /100 | #170 | Average 29.1% |
| Puget Sound Salish | 55.1 /100 | #171 | Average 29.1% |
| Carpatho Rusyns | 53.8 /100 | #172 | Average 29.1% |
| British | 50.6 /100 | #173 | Average 29.2% |
| Immigrants | Saudi Arabia | 50.0 /100 | #174 | Average 29.2% |
| Immigrants | Costa Rica | 48.8 /100 | #175 | Average 29.2% |
| Hawaiians | 47.8 /100 | #176 | Average 29.2% |
| Immigrants | Bosnia and Herzegovina | 45.1 /100 | #177 | Average 29.2% |