Houma vs Immigrants from Afghanistan Single Mother Poverty
COMPARE
Houma
Immigrants from Afghanistan
Single Mother Poverty
Single Mother Poverty Comparison
Houma
Immigrants from Afghanistan
43.5%
SINGLE MOTHER POVERTY
0.0/ 100
METRIC RATING
346th/ 347
METRIC RANK
28.3%
SINGLE MOTHER POVERTY
92.1/ 100
METRIC RATING
121st/ 347
METRIC RANK
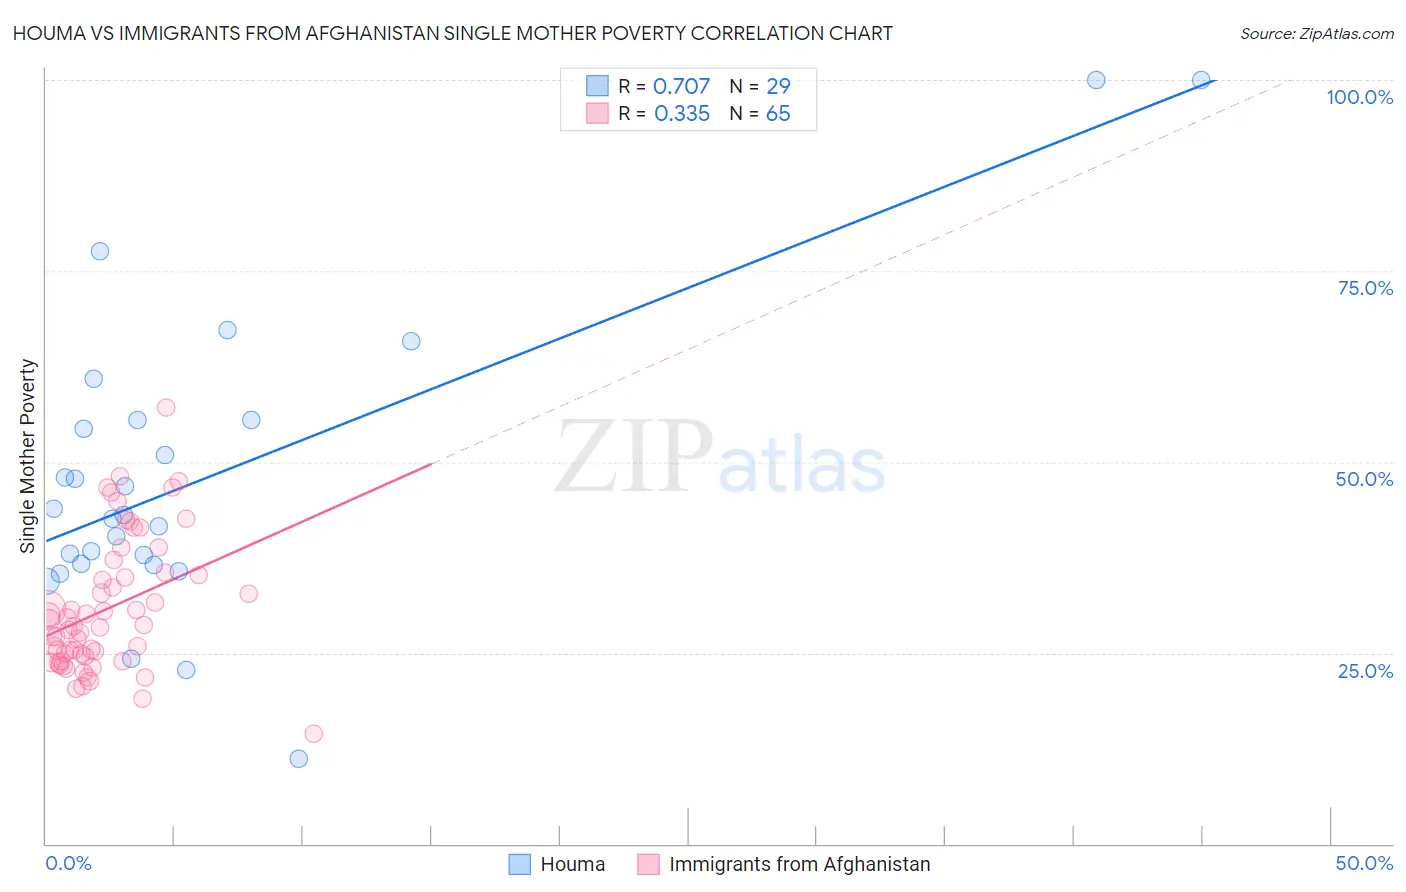
Houma vs Immigrants from Afghanistan Single Mother Poverty Correlation Chart
The statistical analysis conducted on geographies consisting of 36,707,466 people shows a strong positive correlation between the proportion of Houma and poverty level among single mothers in the United States with a correlation coefficient (R) of 0.707 and weighted average of 43.5%. Similarly, the statistical analysis conducted on geographies consisting of 145,984,259 people shows a mild positive correlation between the proportion of Immigrants from Afghanistan and poverty level among single mothers in the United States with a correlation coefficient (R) of 0.335 and weighted average of 28.3%, a difference of 53.7%.
Single Mother Poverty Correlation Summary
| Measurement | Houma | Immigrants from Afghanistan |
| Minimum | 11.1% | 14.5% |
| Maximum | 100.0% | 57.2% |
| Range | 88.9% | 42.7% |
| Mean | 48.0% | 30.7% |
| Median | 43.1% | 28.4% |
| Interquartile 25% (IQ1) | 36.6% | 24.2% |
| Interquartile 75% (IQ3) | 55.5% | 35.4% |
| Interquartile Range (IQR) | 19.0% | 11.1% |
| Standard Deviation (Sample) | 19.9% | 8.7% |
| Standard Deviation (Population) | 19.6% | 8.6% |
Similar Demographics by Single Mother Poverty
Demographics Similar to Houma by Single Mother Poverty
In terms of single mother poverty, the demographic groups most similar to Houma are Lumbee (43.2%, a difference of 0.62%), Tohono O'odham (43.0%, a difference of 1.1%), Puerto Rican (44.5%, a difference of 2.4%), Cajun (40.3%, a difference of 7.9%), and Navajo (40.2%, a difference of 8.2%).
| Demographics | Rating | Rank | Single Mother Poverty |
| Menominee | 0.0 /100 | #333 | Tragic 37.1% |
| Pueblo | 0.0 /100 | #334 | Tragic 37.2% |
| Yuman | 0.0 /100 | #335 | Tragic 37.8% |
| Cheyenne | 0.0 /100 | #336 | Tragic 38.5% |
| Immigrants | Yemen | 0.0 /100 | #337 | Tragic 38.5% |
| Pima | 0.0 /100 | #338 | Tragic 38.6% |
| Crow | 0.0 /100 | #339 | Tragic 38.6% |
| Sioux | 0.0 /100 | #340 | Tragic 38.8% |
| Colville | 0.0 /100 | #341 | Tragic 39.3% |
| Navajo | 0.0 /100 | #342 | Tragic 40.2% |
| Cajuns | 0.0 /100 | #343 | Tragic 40.3% |
| Tohono O'odham | 0.0 /100 | #344 | Tragic 43.0% |
| Lumbee | 0.0 /100 | #345 | Tragic 43.2% |
| Houma | 0.0 /100 | #346 | Tragic 43.5% |
| Puerto Ricans | 0.0 /100 | #347 | Tragic 44.5% |
Demographics Similar to Immigrants from Afghanistan by Single Mother Poverty
In terms of single mother poverty, the demographic groups most similar to Immigrants from Afghanistan are Cypriot (28.3%, a difference of 0.040%), Immigrants from Syria (28.3%, a difference of 0.050%), Colombian (28.3%, a difference of 0.050%), Uruguayan (28.3%, a difference of 0.060%), and Immigrants from Switzerland (28.3%, a difference of 0.060%).
| Demographics | Rating | Rank | Single Mother Poverty |
| Immigrants | Western Asia | 92.7 /100 | #114 | Exceptional 28.3% |
| Immigrants | Kuwait | 92.7 /100 | #115 | Exceptional 28.3% |
| Immigrants | Uganda | 92.5 /100 | #116 | Exceptional 28.3% |
| Australians | 92.5 /100 | #117 | Exceptional 28.3% |
| Brazilians | 92.4 /100 | #118 | Exceptional 28.3% |
| Immigrants | Syria | 92.4 /100 | #119 | Exceptional 28.3% |
| Cypriots | 92.3 /100 | #120 | Exceptional 28.3% |
| Immigrants | Afghanistan | 92.1 /100 | #121 | Exceptional 28.3% |
| Colombians | 91.8 /100 | #122 | Exceptional 28.3% |
| Uruguayans | 91.7 /100 | #123 | Exceptional 28.3% |
| Immigrants | Switzerland | 91.7 /100 | #124 | Exceptional 28.3% |
| Kenyans | 90.9 /100 | #125 | Exceptional 28.4% |
| Immigrants | Chile | 90.8 /100 | #126 | Exceptional 28.4% |
| Poles | 90.8 /100 | #127 | Exceptional 28.4% |
| Immigrants | England | 90.5 /100 | #128 | Exceptional 28.4% |