Ugandan vs New Zealander Single Mother Poverty
COMPARE
Ugandan
New Zealander
Single Mother Poverty
Single Mother Poverty Comparison
Ugandans
New Zealanders
28.8%
SINGLE MOTHER POVERTY
71.7/ 100
METRIC RATING
155th/ 347
METRIC RANK
29.1%
SINGLE MOTHER POVERTY
55.1/ 100
METRIC RATING
170th/ 347
METRIC RANK
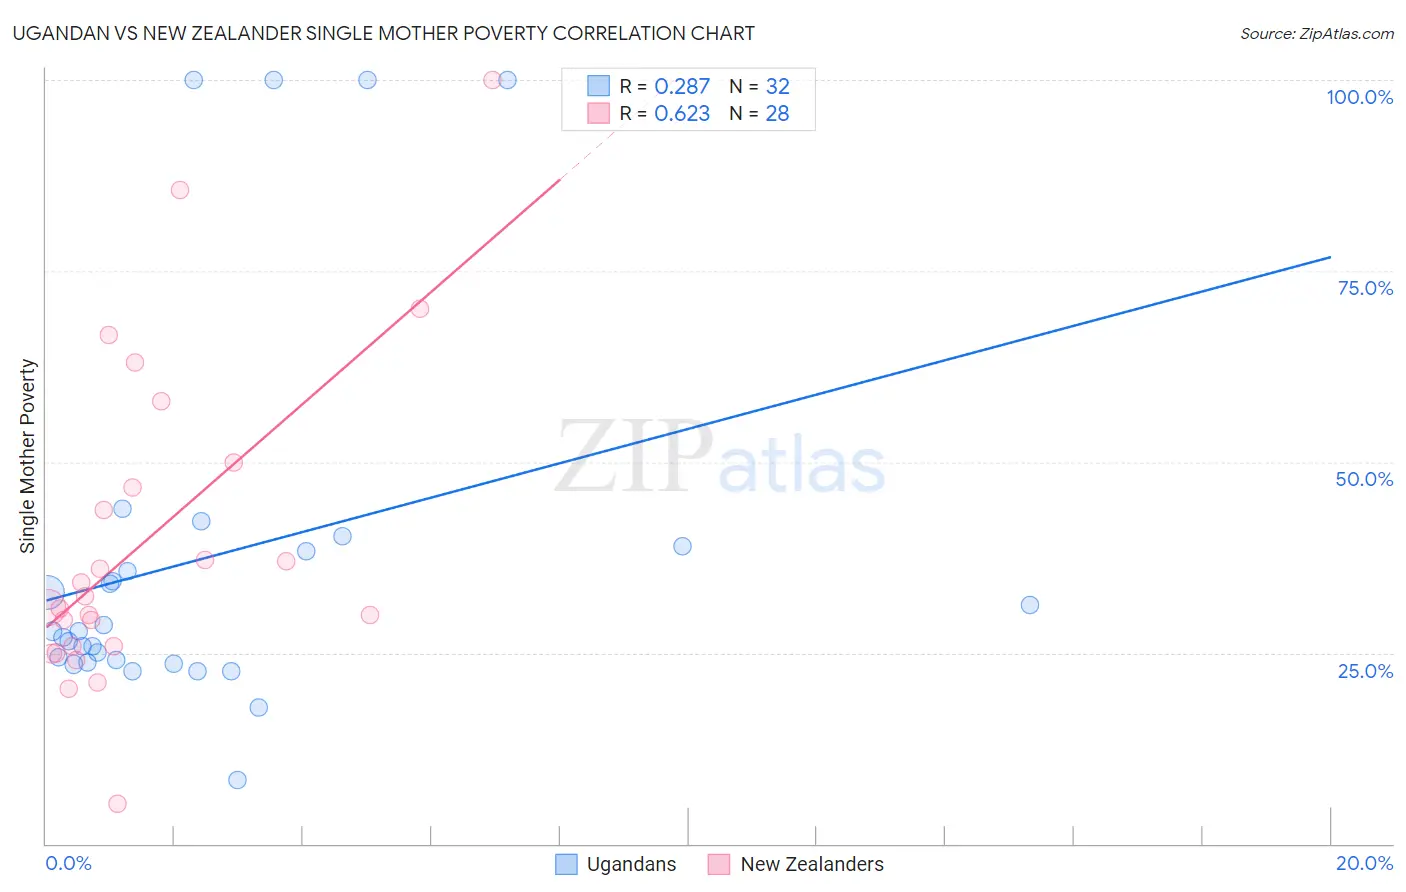
Ugandan vs New Zealander Single Mother Poverty Correlation Chart
The statistical analysis conducted on geographies consisting of 93,563,959 people shows a weak positive correlation between the proportion of Ugandans and poverty level among single mothers in the United States with a correlation coefficient (R) of 0.287 and weighted average of 28.8%. Similarly, the statistical analysis conducted on geographies consisting of 105,692,978 people shows a significant positive correlation between the proportion of New Zealanders and poverty level among single mothers in the United States with a correlation coefficient (R) of 0.623 and weighted average of 29.1%, a difference of 0.88%.
Single Mother Poverty Correlation Summary
| Measurement | Ugandan | New Zealander |
| Minimum | 8.4% | 5.3% |
| Maximum | 100.0% | 100.0% |
| Range | 91.6% | 94.7% |
| Mean | 37.5% | 39.7% |
| Median | 27.8% | 31.7% |
| Interquartile 25% (IQ1) | 23.9% | 25.9% |
| Interquartile 75% (IQ3) | 38.6% | 48.3% |
| Interquartile Range (IQR) | 14.7% | 22.4% |
| Standard Deviation (Sample) | 25.1% | 21.1% |
| Standard Deviation (Population) | 24.7% | 20.8% |
Demographics Similar to Ugandans and New Zealanders by Single Mother Poverty
In terms of single mother poverty, the demographic groups most similar to Ugandans are Iraqi (28.8%, a difference of 0.010%), Immigrants from Western Europe (28.9%, a difference of 0.040%), Immigrants from Hungary (28.9%, a difference of 0.070%), Portuguese (28.8%, a difference of 0.090%), and Czech (28.9%, a difference of 0.19%). Similarly, the demographic groups most similar to New Zealanders are Puget Sound Salish (29.1%, a difference of 0.0%), Carpatho Rusyn (29.1%, a difference of 0.060%), Immigrants from Uruguay (29.1%, a difference of 0.10%), European (29.1%, a difference of 0.12%), and Costa Rican (29.0%, a difference of 0.16%).
| Demographics | Rating | Rank | Single Mother Poverty |
| Austrians | 79.0 /100 | #152 | Good 28.7% |
| Slovenes | 76.4 /100 | #153 | Good 28.8% |
| Portuguese | 73.2 /100 | #154 | Good 28.8% |
| Ugandans | 71.7 /100 | #155 | Good 28.8% |
| Iraqis | 71.5 /100 | #156 | Good 28.8% |
| Immigrants | Western Europe | 71.1 /100 | #157 | Good 28.9% |
| Immigrants | Hungary | 70.6 /100 | #158 | Good 28.9% |
| Czechs | 68.4 /100 | #159 | Good 28.9% |
| Japanese | 68.0 /100 | #160 | Good 28.9% |
| Immigrants | Cambodia | 66.6 /100 | #161 | Good 28.9% |
| Scandinavians | 66.2 /100 | #162 | Good 28.9% |
| Immigrants | Nigeria | 65.9 /100 | #163 | Good 28.9% |
| Immigrants | Kenya | 65.9 /100 | #164 | Good 28.9% |
| Arabs | 60.7 /100 | #165 | Good 29.0% |
| Inupiat | 60.4 /100 | #166 | Good 29.0% |
| Costa Ricans | 58.4 /100 | #167 | Average 29.0% |
| Europeans | 57.6 /100 | #168 | Average 29.1% |
| Immigrants | Uruguay | 57.2 /100 | #169 | Average 29.1% |
| New Zealanders | 55.1 /100 | #170 | Average 29.1% |
| Puget Sound Salish | 55.1 /100 | #171 | Average 29.1% |
| Carpatho Rusyns | 53.8 /100 | #172 | Average 29.1% |