German Russian vs New Zealander Single Mother Poverty
COMPARE
German Russian
New Zealander
Single Mother Poverty
Single Mother Poverty Comparison
German Russians
New Zealanders
31.3%
SINGLE MOTHER POVERTY
0.2/ 100
METRIC RATING
265th/ 347
METRIC RANK
29.1%
SINGLE MOTHER POVERTY
55.1/ 100
METRIC RATING
170th/ 347
METRIC RANK
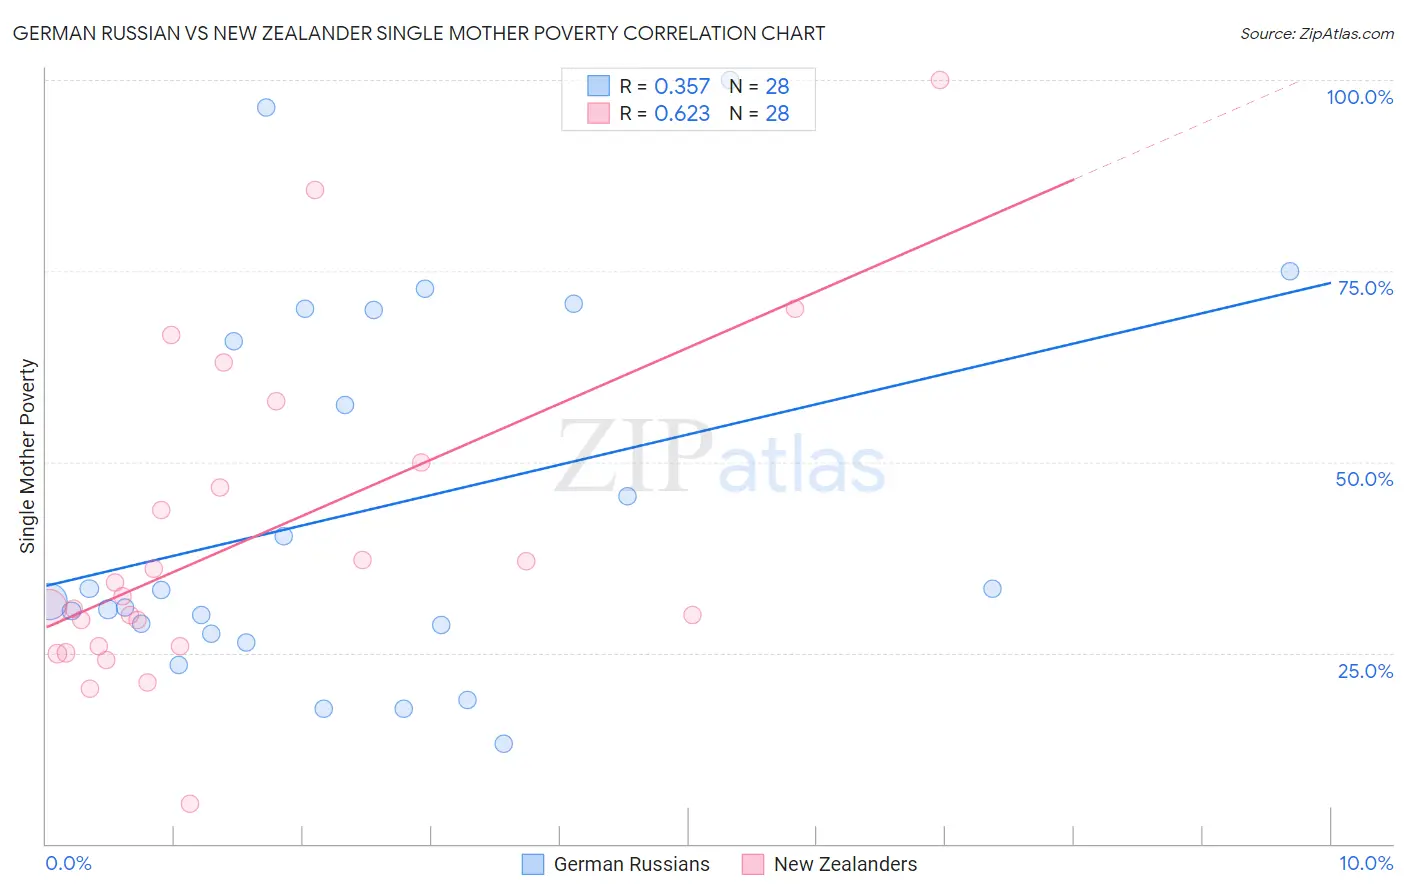
German Russian vs New Zealander Single Mother Poverty Correlation Chart
The statistical analysis conducted on geographies consisting of 95,920,640 people shows a mild positive correlation between the proportion of German Russians and poverty level among single mothers in the United States with a correlation coefficient (R) of 0.357 and weighted average of 31.3%. Similarly, the statistical analysis conducted on geographies consisting of 105,692,978 people shows a significant positive correlation between the proportion of New Zealanders and poverty level among single mothers in the United States with a correlation coefficient (R) of 0.623 and weighted average of 29.1%, a difference of 7.7%.
Single Mother Poverty Correlation Summary
| Measurement | German Russian | New Zealander |
| Minimum | 13.1% | 5.3% |
| Maximum | 100.0% | 100.0% |
| Range | 86.9% | 94.7% |
| Mean | 43.6% | 39.7% |
| Median | 32.5% | 31.7% |
| Interquartile 25% (IQ1) | 28.1% | 25.9% |
| Interquartile 75% (IQ3) | 67.9% | 48.3% |
| Interquartile Range (IQR) | 39.8% | 22.4% |
| Standard Deviation (Sample) | 24.4% | 21.1% |
| Standard Deviation (Population) | 24.0% | 20.8% |
Similar Demographics by Single Mother Poverty
Demographics Similar to German Russians by Single Mother Poverty
In terms of single mother poverty, the demographic groups most similar to German Russians are Immigrants from Ecuador (31.3%, a difference of 0.030%), Bahamian (31.3%, a difference of 0.040%), Subsaharan African (31.4%, a difference of 0.070%), Immigrants from Belize (31.4%, a difference of 0.22%), and Hmong (31.2%, a difference of 0.31%).
| Demographics | Rating | Rank | Single Mother Poverty |
| Immigrants | Caribbean | 0.4 /100 | #258 | Tragic 31.1% |
| Immigrants | Bangladesh | 0.4 /100 | #259 | Tragic 31.1% |
| Whites/Caucasians | 0.3 /100 | #260 | Tragic 31.2% |
| Immigrants | El Salvador | 0.3 /100 | #261 | Tragic 31.2% |
| Hmong | 0.3 /100 | #262 | Tragic 31.2% |
| Bahamians | 0.2 /100 | #263 | Tragic 31.3% |
| Immigrants | Ecuador | 0.2 /100 | #264 | Tragic 31.3% |
| German Russians | 0.2 /100 | #265 | Tragic 31.3% |
| Sub-Saharan Africans | 0.2 /100 | #266 | Tragic 31.4% |
| Immigrants | Belize | 0.2 /100 | #267 | Tragic 31.4% |
| Immigrants | Senegal | 0.1 /100 | #268 | Tragic 31.5% |
| Scotch-Irish | 0.1 /100 | #269 | Tragic 31.5% |
| British West Indians | 0.1 /100 | #270 | Tragic 31.5% |
| Immigrants | Cabo Verde | 0.1 /100 | #271 | Tragic 31.6% |
| Immigrants | Micronesia | 0.1 /100 | #272 | Tragic 31.6% |
Demographics Similar to New Zealanders by Single Mother Poverty
In terms of single mother poverty, the demographic groups most similar to New Zealanders are Puget Sound Salish (29.1%, a difference of 0.0%), Carpatho Rusyn (29.1%, a difference of 0.060%), Immigrants from Uruguay (29.1%, a difference of 0.10%), European (29.1%, a difference of 0.12%), and Costa Rican (29.0%, a difference of 0.16%).
| Demographics | Rating | Rank | Single Mother Poverty |
| Immigrants | Nigeria | 65.9 /100 | #163 | Good 28.9% |
| Immigrants | Kenya | 65.9 /100 | #164 | Good 28.9% |
| Arabs | 60.7 /100 | #165 | Good 29.0% |
| Inupiat | 60.4 /100 | #166 | Good 29.0% |
| Costa Ricans | 58.4 /100 | #167 | Average 29.0% |
| Europeans | 57.6 /100 | #168 | Average 29.1% |
| Immigrants | Uruguay | 57.2 /100 | #169 | Average 29.1% |
| New Zealanders | 55.1 /100 | #170 | Average 29.1% |
| Puget Sound Salish | 55.1 /100 | #171 | Average 29.1% |
| Carpatho Rusyns | 53.8 /100 | #172 | Average 29.1% |
| British | 50.6 /100 | #173 | Average 29.2% |
| Immigrants | Saudi Arabia | 50.0 /100 | #174 | Average 29.2% |
| Immigrants | Costa Rica | 48.8 /100 | #175 | Average 29.2% |
| Hawaiians | 47.8 /100 | #176 | Average 29.2% |
| Immigrants | Bosnia and Herzegovina | 45.1 /100 | #177 | Average 29.2% |