Houma vs Czech Single Mother Poverty
COMPARE
Houma
Czech
Single Mother Poverty
Single Mother Poverty Comparison
Houma
Czechs
43.5%
SINGLE MOTHER POVERTY
0.0/ 100
METRIC RATING
346th/ 347
METRIC RANK
28.9%
SINGLE MOTHER POVERTY
68.4/ 100
METRIC RATING
159th/ 347
METRIC RANK
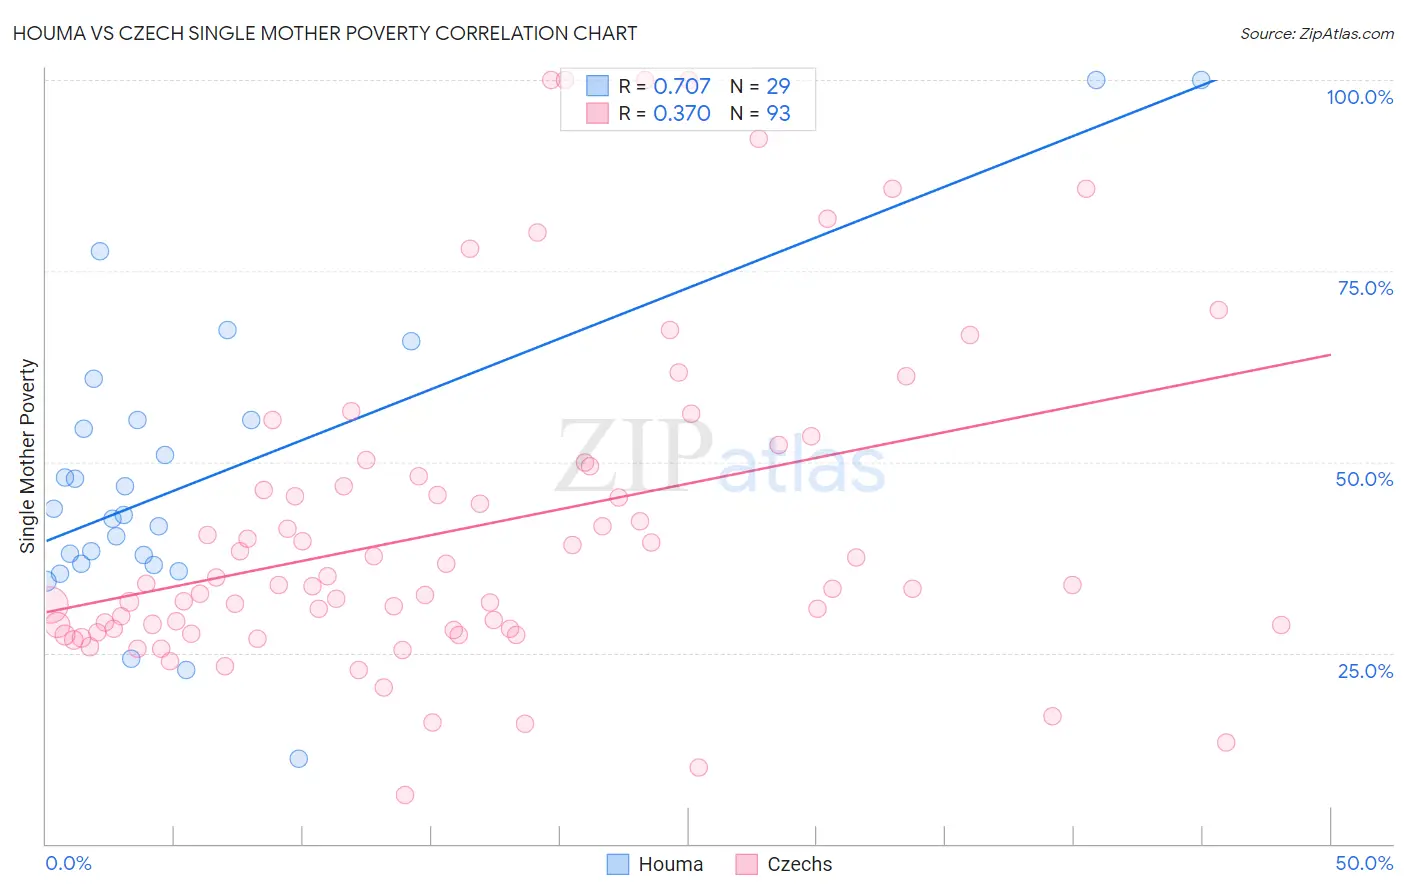
Houma vs Czech Single Mother Poverty Correlation Chart
The statistical analysis conducted on geographies consisting of 36,707,466 people shows a strong positive correlation between the proportion of Houma and poverty level among single mothers in the United States with a correlation coefficient (R) of 0.707 and weighted average of 43.5%. Similarly, the statistical analysis conducted on geographies consisting of 466,588,307 people shows a mild positive correlation between the proportion of Czechs and poverty level among single mothers in the United States with a correlation coefficient (R) of 0.370 and weighted average of 28.9%, a difference of 50.6%.
Single Mother Poverty Correlation Summary
| Measurement | Houma | Czech |
| Minimum | 11.1% | 6.4% |
| Maximum | 100.0% | 100.0% |
| Range | 88.9% | 93.6% |
| Mean | 48.0% | 41.3% |
| Median | 43.1% | 33.8% |
| Interquartile 25% (IQ1) | 36.6% | 28.1% |
| Interquartile 75% (IQ3) | 55.5% | 48.7% |
| Interquartile Range (IQR) | 19.0% | 20.7% |
| Standard Deviation (Sample) | 19.9% | 21.1% |
| Standard Deviation (Population) | 19.6% | 21.0% |
Similar Demographics by Single Mother Poverty
Demographics Similar to Houma by Single Mother Poverty
In terms of single mother poverty, the demographic groups most similar to Houma are Lumbee (43.2%, a difference of 0.62%), Tohono O'odham (43.0%, a difference of 1.1%), Puerto Rican (44.5%, a difference of 2.4%), Cajun (40.3%, a difference of 7.9%), and Navajo (40.2%, a difference of 8.2%).
| Demographics | Rating | Rank | Single Mother Poverty |
| Menominee | 0.0 /100 | #333 | Tragic 37.1% |
| Pueblo | 0.0 /100 | #334 | Tragic 37.2% |
| Yuman | 0.0 /100 | #335 | Tragic 37.8% |
| Cheyenne | 0.0 /100 | #336 | Tragic 38.5% |
| Immigrants | Yemen | 0.0 /100 | #337 | Tragic 38.5% |
| Pima | 0.0 /100 | #338 | Tragic 38.6% |
| Crow | 0.0 /100 | #339 | Tragic 38.6% |
| Sioux | 0.0 /100 | #340 | Tragic 38.8% |
| Colville | 0.0 /100 | #341 | Tragic 39.3% |
| Navajo | 0.0 /100 | #342 | Tragic 40.2% |
| Cajuns | 0.0 /100 | #343 | Tragic 40.3% |
| Tohono O'odham | 0.0 /100 | #344 | Tragic 43.0% |
| Lumbee | 0.0 /100 | #345 | Tragic 43.2% |
| Houma | 0.0 /100 | #346 | Tragic 43.5% |
| Puerto Ricans | 0.0 /100 | #347 | Tragic 44.5% |
Demographics Similar to Czechs by Single Mother Poverty
In terms of single mother poverty, the demographic groups most similar to Czechs are Japanese (28.9%, a difference of 0.020%), Immigrants from Cambodia (28.9%, a difference of 0.10%), Immigrants from Hungary (28.9%, a difference of 0.12%), Scandinavian (28.9%, a difference of 0.12%), and Immigrants from Nigeria (28.9%, a difference of 0.14%).
| Demographics | Rating | Rank | Single Mother Poverty |
| Austrians | 79.0 /100 | #152 | Good 28.7% |
| Slovenes | 76.4 /100 | #153 | Good 28.8% |
| Portuguese | 73.2 /100 | #154 | Good 28.8% |
| Ugandans | 71.7 /100 | #155 | Good 28.8% |
| Iraqis | 71.5 /100 | #156 | Good 28.8% |
| Immigrants | Western Europe | 71.1 /100 | #157 | Good 28.9% |
| Immigrants | Hungary | 70.6 /100 | #158 | Good 28.9% |
| Czechs | 68.4 /100 | #159 | Good 28.9% |
| Japanese | 68.0 /100 | #160 | Good 28.9% |
| Immigrants | Cambodia | 66.6 /100 | #161 | Good 28.9% |
| Scandinavians | 66.2 /100 | #162 | Good 28.9% |
| Immigrants | Nigeria | 65.9 /100 | #163 | Good 28.9% |
| Immigrants | Kenya | 65.9 /100 | #164 | Good 28.9% |
| Arabs | 60.7 /100 | #165 | Good 29.0% |
| Inupiat | 60.4 /100 | #166 | Good 29.0% |