Houma vs Estonian Single Mother Poverty
COMPARE
Houma
Estonian
Single Mother Poverty
Single Mother Poverty Comparison
Houma
Estonians
43.5%
SINGLE MOTHER POVERTY
0.0/ 100
METRIC RATING
346th/ 347
METRIC RANK
27.8%
SINGLE MOTHER POVERTY
97.9/ 100
METRIC RATING
92nd/ 347
METRIC RANK
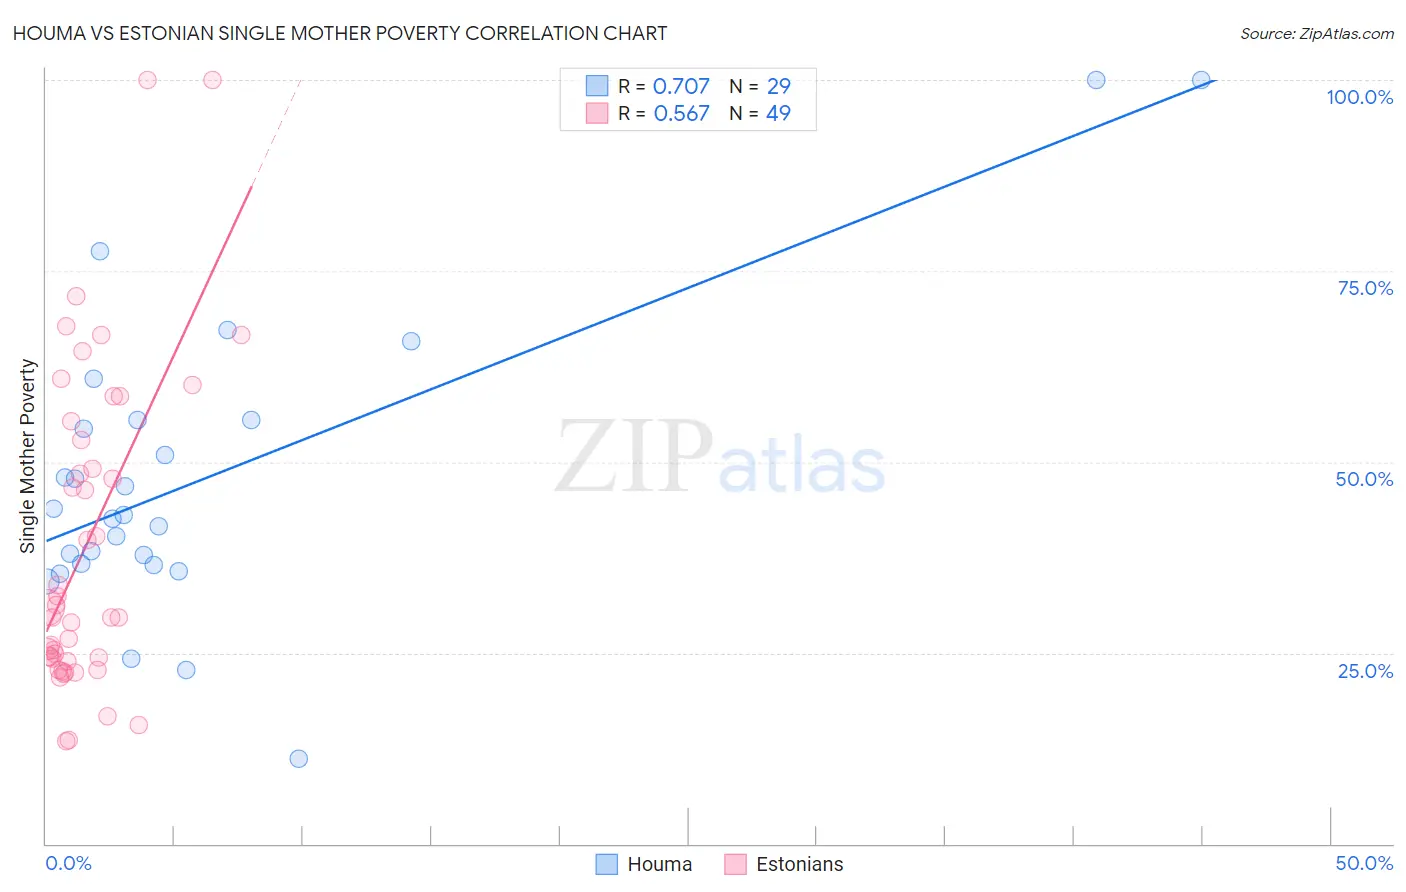
Houma vs Estonian Single Mother Poverty Correlation Chart
The statistical analysis conducted on geographies consisting of 36,707,466 people shows a strong positive correlation between the proportion of Houma and poverty level among single mothers in the United States with a correlation coefficient (R) of 0.707 and weighted average of 43.5%. Similarly, the statistical analysis conducted on geographies consisting of 121,617,183 people shows a substantial positive correlation between the proportion of Estonians and poverty level among single mothers in the United States with a correlation coefficient (R) of 0.567 and weighted average of 27.8%, a difference of 56.4%.
Single Mother Poverty Correlation Summary
| Measurement | Houma | Estonian |
| Minimum | 11.1% | 13.5% |
| Maximum | 100.0% | 100.0% |
| Range | 88.9% | 86.5% |
| Mean | 48.0% | 39.1% |
| Median | 43.1% | 29.6% |
| Interquartile 25% (IQ1) | 36.6% | 24.1% |
| Interquartile 75% (IQ3) | 55.5% | 54.1% |
| Interquartile Range (IQR) | 19.0% | 30.0% |
| Standard Deviation (Sample) | 19.9% | 20.8% |
| Standard Deviation (Population) | 19.6% | 20.6% |
Similar Demographics by Single Mother Poverty
Demographics Similar to Houma by Single Mother Poverty
In terms of single mother poverty, the demographic groups most similar to Houma are Lumbee (43.2%, a difference of 0.62%), Tohono O'odham (43.0%, a difference of 1.1%), Puerto Rican (44.5%, a difference of 2.4%), Cajun (40.3%, a difference of 7.9%), and Navajo (40.2%, a difference of 8.2%).
| Demographics | Rating | Rank | Single Mother Poverty |
| Menominee | 0.0 /100 | #333 | Tragic 37.1% |
| Pueblo | 0.0 /100 | #334 | Tragic 37.2% |
| Yuman | 0.0 /100 | #335 | Tragic 37.8% |
| Cheyenne | 0.0 /100 | #336 | Tragic 38.5% |
| Immigrants | Yemen | 0.0 /100 | #337 | Tragic 38.5% |
| Pima | 0.0 /100 | #338 | Tragic 38.6% |
| Crow | 0.0 /100 | #339 | Tragic 38.6% |
| Sioux | 0.0 /100 | #340 | Tragic 38.8% |
| Colville | 0.0 /100 | #341 | Tragic 39.3% |
| Navajo | 0.0 /100 | #342 | Tragic 40.2% |
| Cajuns | 0.0 /100 | #343 | Tragic 40.3% |
| Tohono O'odham | 0.0 /100 | #344 | Tragic 43.0% |
| Lumbee | 0.0 /100 | #345 | Tragic 43.2% |
| Houma | 0.0 /100 | #346 | Tragic 43.5% |
| Puerto Ricans | 0.0 /100 | #347 | Tragic 44.5% |
Demographics Similar to Estonians by Single Mother Poverty
In terms of single mother poverty, the demographic groups most similar to Estonians are Immigrants from Albania (27.8%, a difference of 0.030%), Romanian (27.8%, a difference of 0.10%), Immigrants from France (27.8%, a difference of 0.17%), Albanian (27.9%, a difference of 0.19%), and Chilean (27.9%, a difference of 0.22%).
| Demographics | Rating | Rank | Single Mother Poverty |
| Mongolians | 98.7 /100 | #85 | Exceptional 27.7% |
| Immigrants | Ukraine | 98.6 /100 | #86 | Exceptional 27.7% |
| Afghans | 98.5 /100 | #87 | Exceptional 27.7% |
| Ethiopians | 98.4 /100 | #88 | Exceptional 27.7% |
| Immigrants | Ethiopia | 98.4 /100 | #89 | Exceptional 27.7% |
| Immigrants | France | 98.2 /100 | #90 | Exceptional 27.8% |
| Immigrants | Albania | 98.0 /100 | #91 | Exceptional 27.8% |
| Estonians | 97.9 /100 | #92 | Exceptional 27.8% |
| Romanians | 97.8 /100 | #93 | Exceptional 27.8% |
| Albanians | 97.6 /100 | #94 | Exceptional 27.9% |
| Chileans | 97.5 /100 | #95 | Exceptional 27.9% |
| Immigrants | Iraq | 97.3 /100 | #96 | Exceptional 27.9% |
| Immigrants | Brazil | 97.2 /100 | #97 | Exceptional 27.9% |
| Immigrants | Nepal | 97.2 /100 | #98 | Exceptional 27.9% |
| Immigrants | Netherlands | 97.2 /100 | #99 | Exceptional 27.9% |