Ghanaian vs Apache Family Households with Children
COMPARE
Ghanaian
Apache
Family Households with Children
Family Households with Children Comparison
Ghanaians
Apache
28.5%
FAMILY HOUSEHOLDS WITH CHILDREN
99.9/ 100
METRIC RATING
67th/ 347
METRIC RANK
29.0%
FAMILY HOUSEHOLDS WITH CHILDREN
100.0/ 100
METRIC RATING
48th/ 347
METRIC RANK
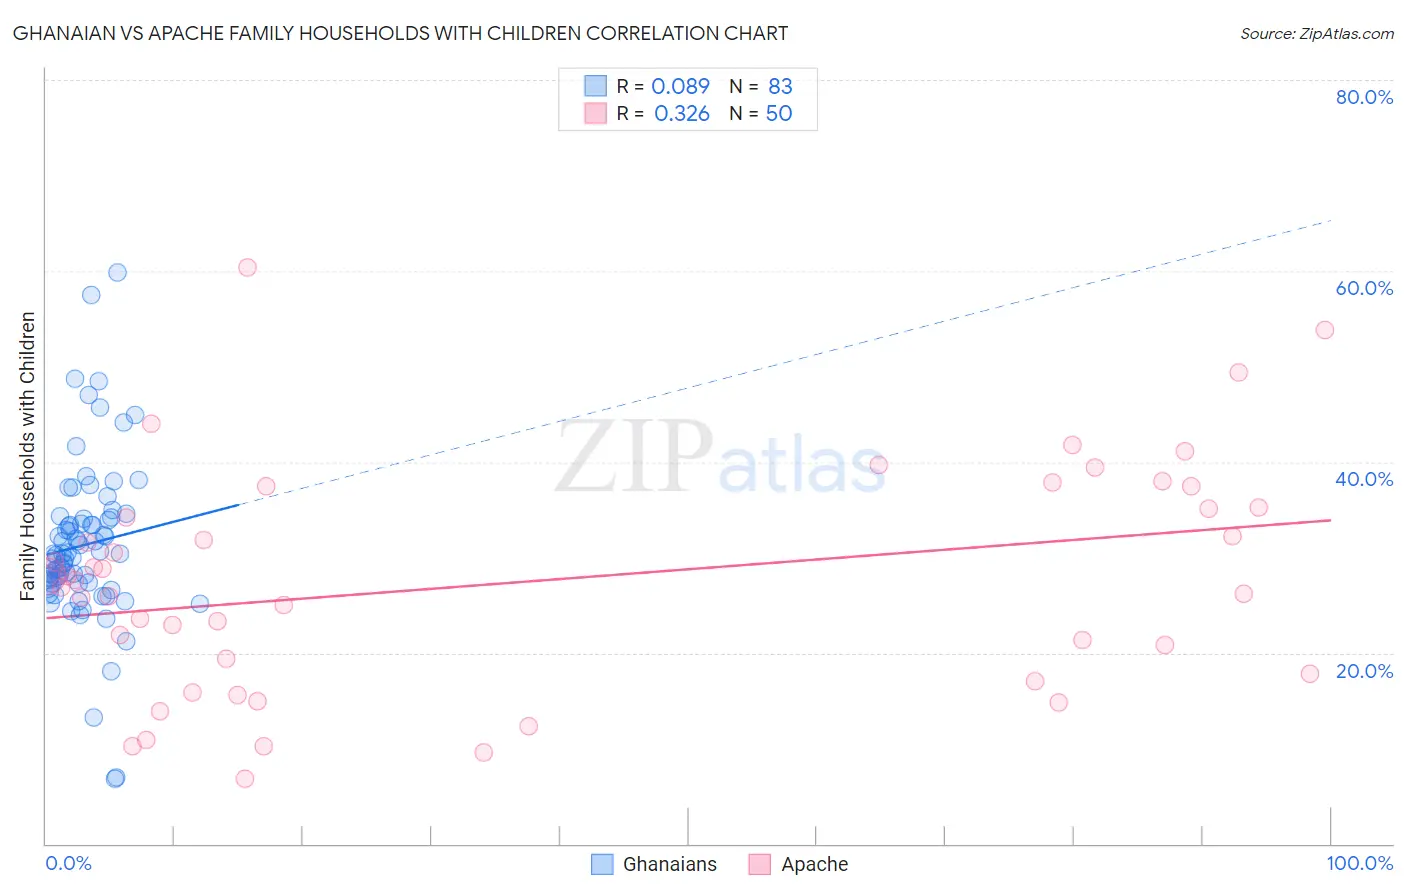
Ghanaian vs Apache Family Households with Children Correlation Chart
The statistical analysis conducted on geographies consisting of 190,475,172 people shows a slight positive correlation between the proportion of Ghanaians and percentage of family households with children in the United States with a correlation coefficient (R) of 0.089 and weighted average of 28.5%. Similarly, the statistical analysis conducted on geographies consisting of 231,023,024 people shows a mild positive correlation between the proportion of Apache and percentage of family households with children in the United States with a correlation coefficient (R) of 0.326 and weighted average of 29.0%, a difference of 1.6%.
Family Households with Children Correlation Summary
| Measurement | Ghanaian | Apache |
| Minimum | 6.8% | 6.8% |
| Maximum | 59.8% | 60.3% |
| Range | 53.0% | 53.6% |
| Mean | 31.3% | 27.5% |
| Median | 30.4% | 27.2% |
| Interquartile 25% (IQ1) | 27.3% | 17.8% |
| Interquartile 75% (IQ3) | 34.0% | 35.2% |
| Interquartile Range (IQR) | 6.7% | 17.4% |
| Standard Deviation (Sample) | 8.4% | 11.9% |
| Standard Deviation (Population) | 8.4% | 11.8% |
Demographics Similar to Ghanaians and Apache by Family Households with Children
In terms of family households with children, the demographic groups most similar to Ghanaians are Immigrants from Egypt (28.5%, a difference of 0.0%), Honduran (28.5%, a difference of 0.010%), Filipino (28.6%, a difference of 0.090%), Immigrants from Lebanon (28.6%, a difference of 0.15%), and Immigrants from Ghana (28.6%, a difference of 0.17%). Similarly, the demographic groups most similar to Apache are Peruvian (29.0%, a difference of 0.030%), Jordanian (29.0%, a difference of 0.090%), Immigrants (28.9%, a difference of 0.20%), Immigrants from Peru (28.9%, a difference of 0.23%), and Guatemalan (28.9%, a difference of 0.31%).
| Demographics | Rating | Rank | Family Households with Children |
| Peruvians | 100.0 /100 | #47 | Exceptional 29.0% |
| Apache | 100.0 /100 | #48 | Exceptional 29.0% |
| Jordanians | 100.0 /100 | #49 | Exceptional 29.0% |
| Immigrants | Immigrants | 100.0 /100 | #50 | Exceptional 28.9% |
| Immigrants | Peru | 100.0 /100 | #51 | Exceptional 28.9% |
| Guatemalans | 100.0 /100 | #52 | Exceptional 28.9% |
| Immigrants | Cambodia | 100.0 /100 | #53 | Exceptional 28.9% |
| Sierra Leoneans | 100.0 /100 | #54 | Exceptional 28.9% |
| Immigrants | Asia | 100.0 /100 | #55 | Exceptional 28.8% |
| Immigrants | Guatemala | 100.0 /100 | #56 | Exceptional 28.8% |
| Danes | 100.0 /100 | #57 | Exceptional 28.7% |
| Hawaiians | 100.0 /100 | #58 | Exceptional 28.7% |
| Immigrants | Nigeria | 100.0 /100 | #59 | Exceptional 28.6% |
| Hmong | 99.9 /100 | #60 | Exceptional 28.6% |
| Immigrants | Ghana | 99.9 /100 | #61 | Exceptional 28.6% |
| Egyptians | 99.9 /100 | #62 | Exceptional 28.6% |
| Immigrants | Lebanon | 99.9 /100 | #63 | Exceptional 28.6% |
| Filipinos | 99.9 /100 | #64 | Exceptional 28.6% |
| Hondurans | 99.9 /100 | #65 | Exceptional 28.5% |
| Immigrants | Egypt | 99.9 /100 | #66 | Exceptional 28.5% |
| Ghanaians | 99.9 /100 | #67 | Exceptional 28.5% |