Ghanaian vs Apache Family Households
COMPARE
Ghanaian
Apache
Family Households
Family Households Comparison
Ghanaians
Apache
63.5%
FAMILY HOUSEHOLDS
2.1/ 100
METRIC RATING
236th/ 347
METRIC RANK
66.5%
FAMILY HOUSEHOLDS
100.0/ 100
METRIC RATING
43rd/ 347
METRIC RANK
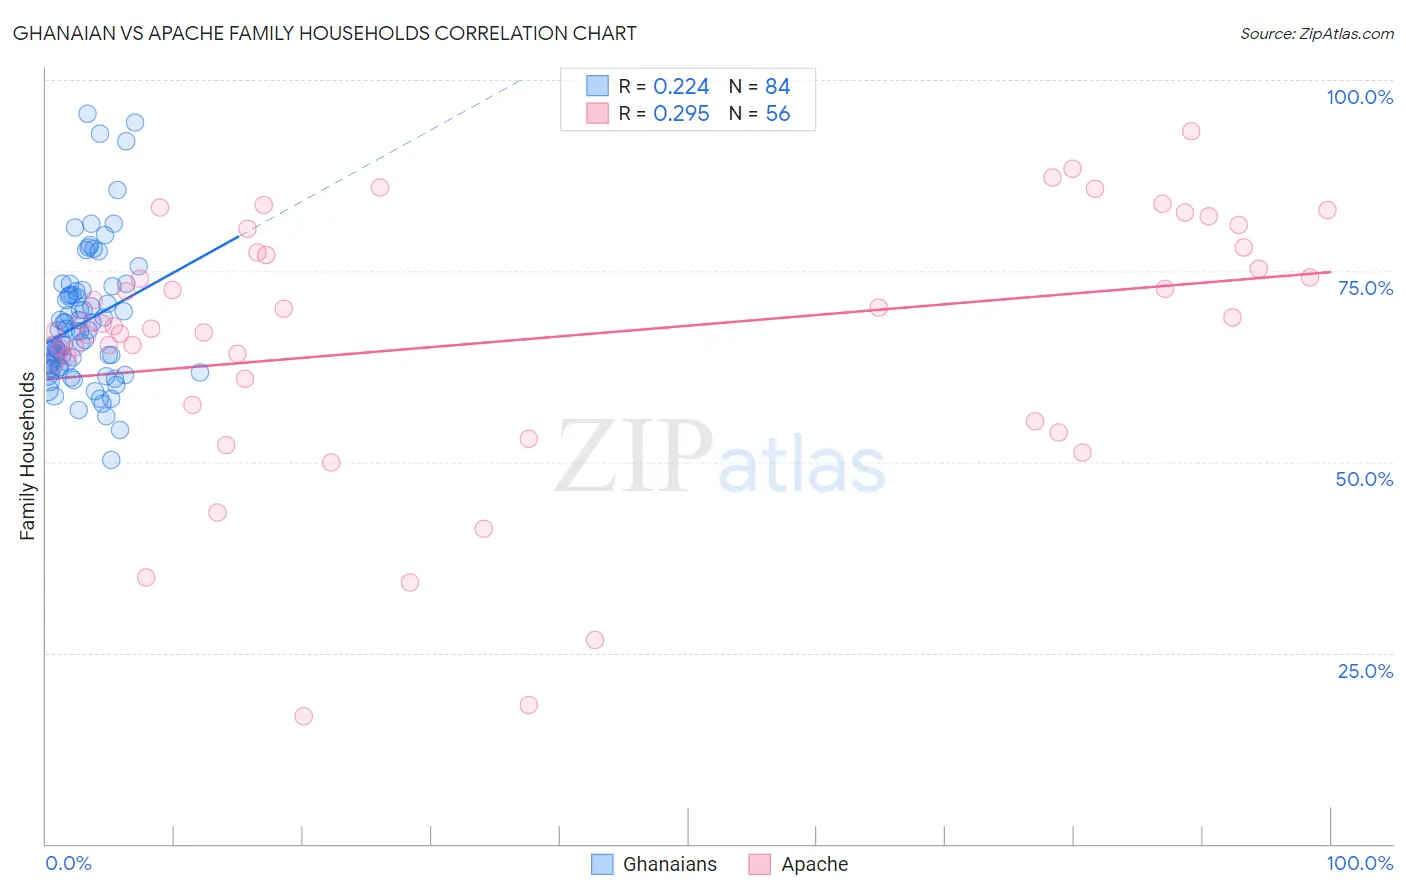
Ghanaian vs Apache Family Households Correlation Chart
The statistical analysis conducted on geographies consisting of 190,523,422 people shows a weak positive correlation between the proportion of Ghanaians and percentage of family households in the United States with a correlation coefficient (R) of 0.224 and weighted average of 63.5%. Similarly, the statistical analysis conducted on geographies consisting of 231,040,944 people shows a weak positive correlation between the proportion of Apache and percentage of family households in the United States with a correlation coefficient (R) of 0.295 and weighted average of 66.5%, a difference of 4.8%.
Family Households Correlation Summary
| Measurement | Ghanaian | Apache |
| Minimum | 50.2% | 16.7% |
| Maximum | 95.6% | 93.2% |
| Range | 45.4% | 76.6% |
| Mean | 68.3% | 66.0% |
| Median | 67.1% | 67.9% |
| Interquartile 25% (IQ1) | 62.3% | 59.1% |
| Interquartile 75% (IQ3) | 72.1% | 77.7% |
| Interquartile Range (IQR) | 9.9% | 18.6% |
| Standard Deviation (Sample) | 8.9% | 17.1% |
| Standard Deviation (Population) | 8.8% | 16.9% |
Similar Demographics by Family Households
Demographics Similar to Ghanaians by Family Households
In terms of family households, the demographic groups most similar to Ghanaians are Comanche (63.5%, a difference of 0.0%), Albanian (63.5%, a difference of 0.010%), Immigrants from Zimbabwe (63.5%, a difference of 0.010%), Finnish (63.5%, a difference of 0.040%), and Aleut (63.4%, a difference of 0.040%).
| Demographics | Rating | Rank | Family Households |
| Bulgarians | 3.4 /100 | #229 | Tragic 63.6% |
| Immigrants | Brazil | 3.0 /100 | #230 | Tragic 63.6% |
| Immigrants | Greece | 2.9 /100 | #231 | Tragic 63.5% |
| Immigrants | Northern Africa | 2.6 /100 | #232 | Tragic 63.5% |
| Immigrants | Armenia | 2.6 /100 | #233 | Tragic 63.5% |
| Finns | 2.3 /100 | #234 | Tragic 63.5% |
| Albanians | 2.2 /100 | #235 | Tragic 63.5% |
| Ghanaians | 2.1 /100 | #236 | Tragic 63.5% |
| Comanche | 2.1 /100 | #237 | Tragic 63.5% |
| Immigrants | Zimbabwe | 2.0 /100 | #238 | Tragic 63.5% |
| Aleuts | 1.9 /100 | #239 | Tragic 63.4% |
| South Africans | 1.9 /100 | #240 | Tragic 63.4% |
| Immigrants | St. Vincent and the Grenadines | 1.9 /100 | #241 | Tragic 63.4% |
| Immigrants | Israel | 1.8 /100 | #242 | Tragic 63.4% |
| Immigrants | Czechoslovakia | 1.8 /100 | #243 | Tragic 63.4% |
Demographics Similar to Apache by Family Households
In terms of family households, the demographic groups most similar to Apache are Menominee (66.5%, a difference of 0.010%), Asian (66.5%, a difference of 0.050%), Immigrants from Bolivia (66.6%, a difference of 0.070%), Venezuelan (66.5%, a difference of 0.070%), and Arapaho (66.5%, a difference of 0.090%).
| Demographics | Rating | Rank | Family Households |
| Peruvians | 100.0 /100 | #36 | Exceptional 67.1% |
| Tsimshian | 100.0 /100 | #37 | Exceptional 67.1% |
| Mexican American Indians | 100.0 /100 | #38 | Exceptional 67.0% |
| Immigrants | El Salvador | 100.0 /100 | #39 | Exceptional 67.0% |
| Guamanians/Chamorros | 100.0 /100 | #40 | Exceptional 66.6% |
| Immigrants | Bolivia | 100.0 /100 | #41 | Exceptional 66.6% |
| Menominee | 100.0 /100 | #42 | Exceptional 66.5% |
| Apache | 100.0 /100 | #43 | Exceptional 66.5% |
| Asians | 100.0 /100 | #44 | Exceptional 66.5% |
| Venezuelans | 100.0 /100 | #45 | Exceptional 66.5% |
| Arapaho | 100.0 /100 | #46 | Exceptional 66.5% |
| Bolivians | 100.0 /100 | #47 | Exceptional 66.5% |
| Immigrants | Venezuela | 100.0 /100 | #48 | Exceptional 66.4% |
| Immigrants | South Central Asia | 100.0 /100 | #49 | Exceptional 66.4% |
| Navajo | 100.0 /100 | #50 | Exceptional 66.4% |