Ghanaian vs Immigrants from Dominica Single Female Poverty
COMPARE
Ghanaian
Immigrants from Dominica
Single Female Poverty
Single Female Poverty Comparison
Ghanaians
Immigrants from Dominica
21.6%
SINGLE FEMALE POVERTY
15.7/ 100
METRIC RATING
207th/ 347
METRIC RANK
23.9%
SINGLE FEMALE POVERTY
0.0/ 100
METRIC RATING
284th/ 347
METRIC RANK
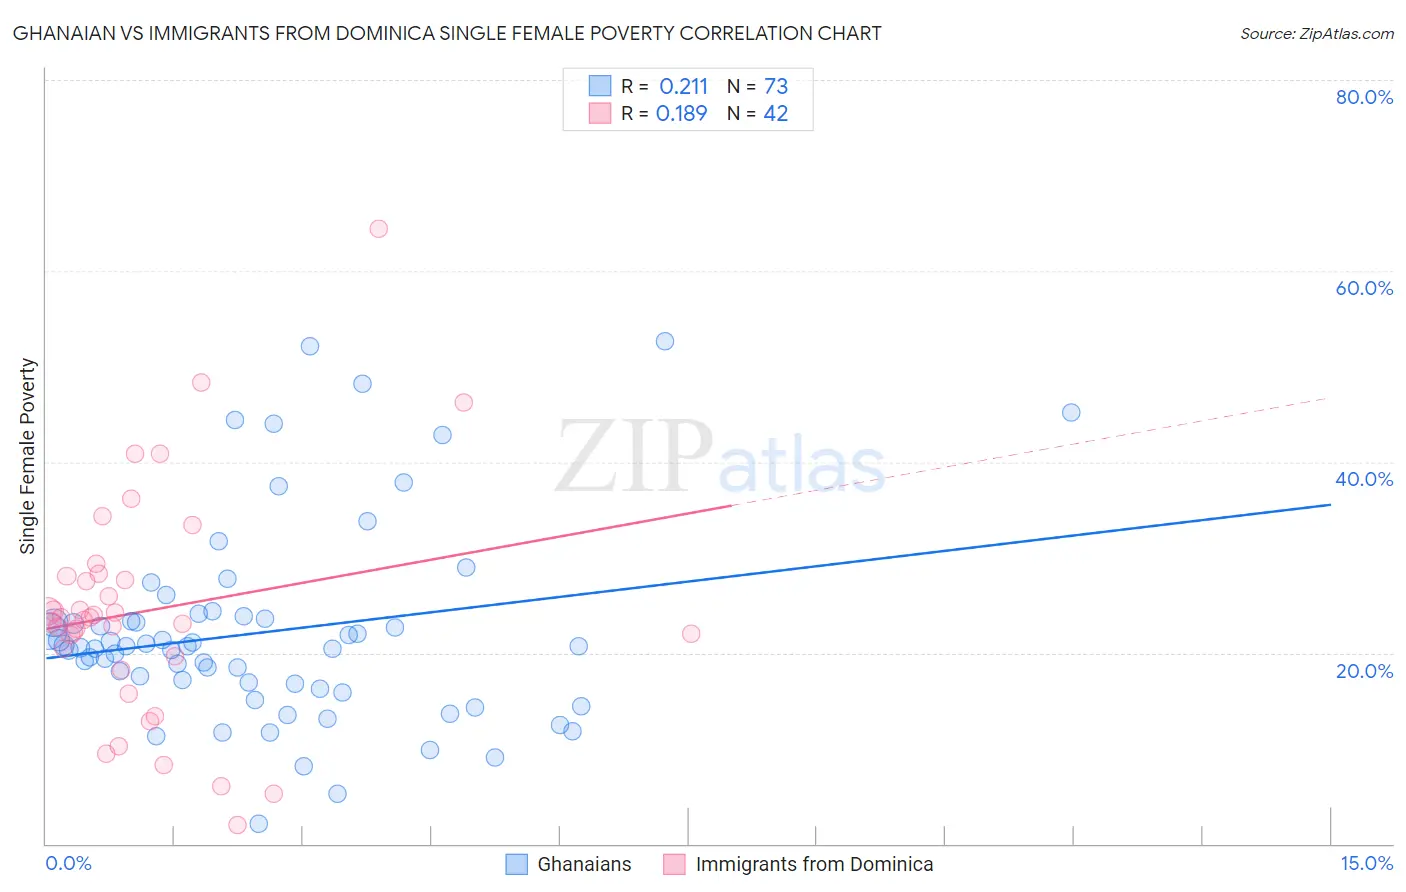
Ghanaian vs Immigrants from Dominica Single Female Poverty Correlation Chart
The statistical analysis conducted on geographies consisting of 189,278,551 people shows a weak positive correlation between the proportion of Ghanaians and poverty level among single females in the United States with a correlation coefficient (R) of 0.211 and weighted average of 21.6%. Similarly, the statistical analysis conducted on geographies consisting of 83,649,694 people shows a poor positive correlation between the proportion of Immigrants from Dominica and poverty level among single females in the United States with a correlation coefficient (R) of 0.189 and weighted average of 23.9%, a difference of 10.9%.
Single Female Poverty Correlation Summary
| Measurement | Ghanaian | Immigrants from Dominica |
| Minimum | 2.1% | 2.0% |
| Maximum | 52.6% | 64.4% |
| Range | 50.5% | 62.4% |
| Mean | 22.2% | 24.4% |
| Median | 20.7% | 23.5% |
| Interquartile 25% (IQ1) | 16.5% | 19.7% |
| Interquartile 75% (IQ3) | 23.7% | 28.1% |
| Interquartile Range (IQR) | 7.2% | 8.4% |
| Standard Deviation (Sample) | 10.4% | 12.0% |
| Standard Deviation (Population) | 10.3% | 11.9% |
Similar Demographics by Single Female Poverty
Demographics Similar to Ghanaians by Single Female Poverty
In terms of single female poverty, the demographic groups most similar to Ghanaians are Belgian (21.5%, a difference of 0.040%), Haitian (21.6%, a difference of 0.040%), Finnish (21.5%, a difference of 0.050%), Immigrants from Eastern Africa (21.6%, a difference of 0.070%), and Immigrants from Africa (21.5%, a difference of 0.11%).
| Demographics | Rating | Rank | Single Female Poverty |
| Irish | 21.4 /100 | #200 | Fair 21.4% |
| Nigerians | 20.9 /100 | #201 | Fair 21.4% |
| Immigrants | Kenya | 20.7 /100 | #202 | Fair 21.4% |
| Immigrants | Haiti | 18.8 /100 | #203 | Poor 21.5% |
| Immigrants | Africa | 16.7 /100 | #204 | Poor 21.5% |
| Finns | 16.2 /100 | #205 | Poor 21.5% |
| Belgians | 16.1 /100 | #206 | Poor 21.5% |
| Ghanaians | 15.7 /100 | #207 | Poor 21.6% |
| Haitians | 15.4 /100 | #208 | Poor 21.6% |
| Immigrants | Eastern Africa | 15.1 /100 | #209 | Poor 21.6% |
| Immigrants | Panama | 14.4 /100 | #210 | Poor 21.6% |
| Icelanders | 14.0 /100 | #211 | Poor 21.6% |
| Jamaicans | 14.0 /100 | #212 | Poor 21.6% |
| Guamanians/Chamorros | 13.7 /100 | #213 | Poor 21.6% |
| Immigrants | Nicaragua | 13.3 /100 | #214 | Poor 21.6% |
Demographics Similar to Immigrants from Dominica by Single Female Poverty
In terms of single female poverty, the demographic groups most similar to Immigrants from Dominica are German Russian (23.9%, a difference of 0.11%), Guatemalan (23.8%, a difference of 0.25%), Immigrants from Zaire (23.8%, a difference of 0.31%), Immigrants from Latin America (23.7%, a difference of 0.82%), and Immigrants from Guatemala (24.1%, a difference of 0.86%).
| Demographics | Rating | Rank | Single Female Poverty |
| Pennsylvania Germans | 0.0 /100 | #277 | Tragic 23.6% |
| Immigrants | Nonimmigrants | 0.0 /100 | #278 | Tragic 23.6% |
| Alaskan Athabascans | 0.0 /100 | #279 | Tragic 23.6% |
| Immigrants | Latin America | 0.0 /100 | #280 | Tragic 23.7% |
| Immigrants | Zaire | 0.0 /100 | #281 | Tragic 23.8% |
| Guatemalans | 0.0 /100 | #282 | Tragic 23.8% |
| German Russians | 0.0 /100 | #283 | Tragic 23.9% |
| Immigrants | Dominica | 0.0 /100 | #284 | Tragic 23.9% |
| Immigrants | Guatemala | 0.0 /100 | #285 | Tragic 24.1% |
| Cree | 0.0 /100 | #286 | Tragic 24.1% |
| Bangladeshis | 0.0 /100 | #287 | Tragic 24.2% |
| Spanish Americans | 0.0 /100 | #288 | Tragic 24.2% |
| U.S. Virgin Islanders | 0.0 /100 | #289 | Tragic 24.2% |
| Indonesians | 0.0 /100 | #290 | Tragic 24.3% |
| Osage | 0.0 /100 | #291 | Tragic 24.4% |