Ghanaian vs Immigrants from Northern Africa Single Female Poverty
COMPARE
Ghanaian
Immigrants from Northern Africa
Single Female Poverty
Single Female Poverty Comparison
Ghanaians
Immigrants from Northern Africa
21.6%
SINGLE FEMALE POVERTY
15.7/ 100
METRIC RATING
207th/ 347
METRIC RANK
20.0%
SINGLE FEMALE POVERTY
95.8/ 100
METRIC RATING
115th/ 347
METRIC RANK
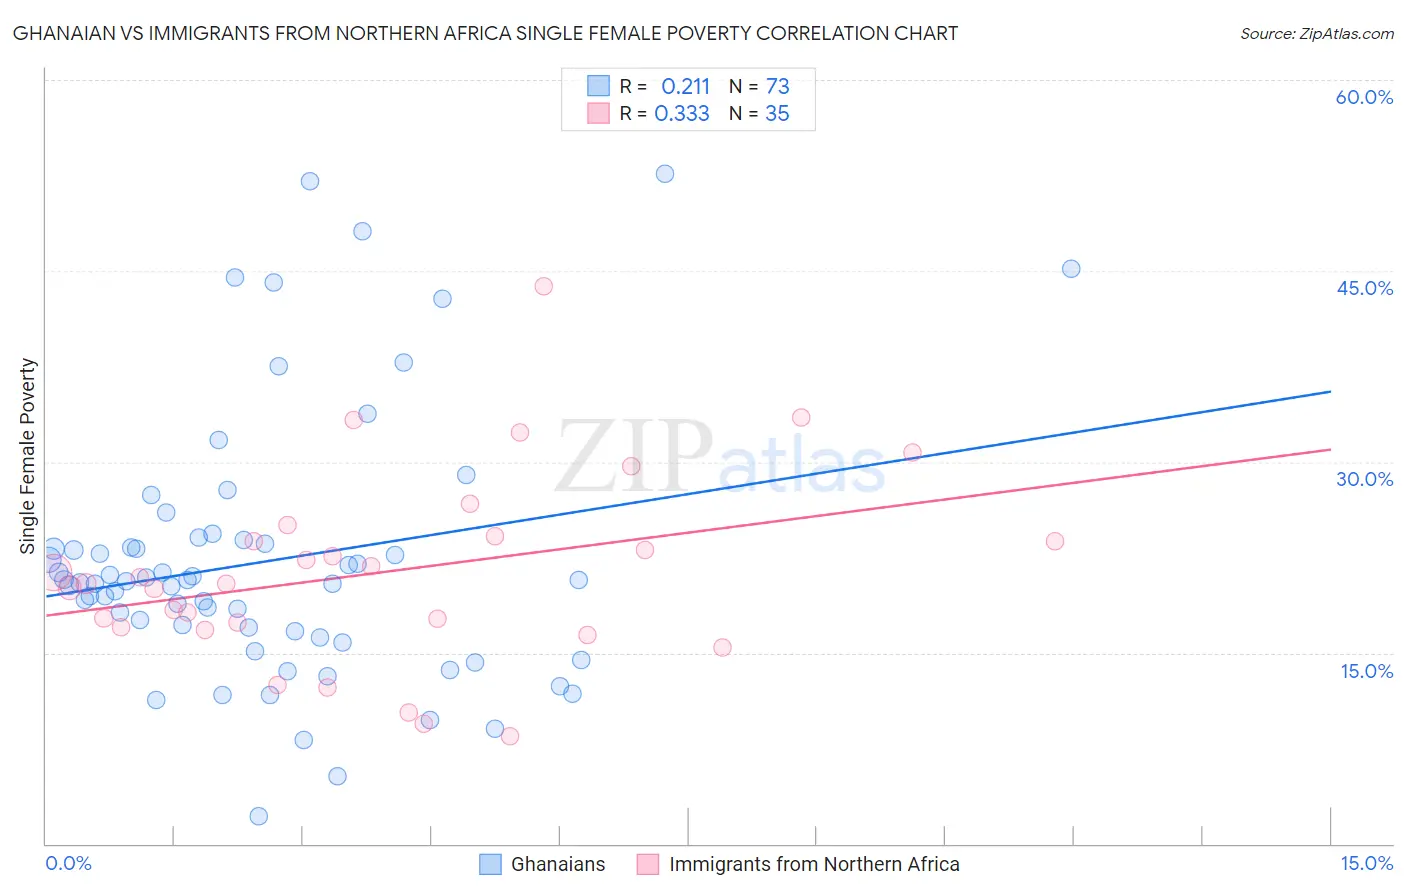
Ghanaian vs Immigrants from Northern Africa Single Female Poverty Correlation Chart
The statistical analysis conducted on geographies consisting of 189,278,551 people shows a weak positive correlation between the proportion of Ghanaians and poverty level among single females in the United States with a correlation coefficient (R) of 0.211 and weighted average of 21.6%. Similarly, the statistical analysis conducted on geographies consisting of 317,382,257 people shows a mild positive correlation between the proportion of Immigrants from Northern Africa and poverty level among single females in the United States with a correlation coefficient (R) of 0.333 and weighted average of 20.0%, a difference of 7.9%.
Single Female Poverty Correlation Summary
| Measurement | Ghanaian | Immigrants from Northern Africa |
| Minimum | 2.1% | 8.4% |
| Maximum | 52.6% | 43.8% |
| Range | 50.5% | 35.3% |
| Mean | 22.2% | 21.4% |
| Median | 20.7% | 20.4% |
| Interquartile 25% (IQ1) | 16.5% | 17.0% |
| Interquartile 75% (IQ3) | 23.7% | 24.1% |
| Interquartile Range (IQR) | 7.2% | 7.1% |
| Standard Deviation (Sample) | 10.4% | 7.5% |
| Standard Deviation (Population) | 10.3% | 7.4% |
Similar Demographics by Single Female Poverty
Demographics Similar to Ghanaians by Single Female Poverty
In terms of single female poverty, the demographic groups most similar to Ghanaians are Belgian (21.5%, a difference of 0.040%), Haitian (21.6%, a difference of 0.040%), Finnish (21.5%, a difference of 0.050%), Immigrants from Eastern Africa (21.6%, a difference of 0.070%), and Immigrants from Africa (21.5%, a difference of 0.11%).
| Demographics | Rating | Rank | Single Female Poverty |
| Irish | 21.4 /100 | #200 | Fair 21.4% |
| Nigerians | 20.9 /100 | #201 | Fair 21.4% |
| Immigrants | Kenya | 20.7 /100 | #202 | Fair 21.4% |
| Immigrants | Haiti | 18.8 /100 | #203 | Poor 21.5% |
| Immigrants | Africa | 16.7 /100 | #204 | Poor 21.5% |
| Finns | 16.2 /100 | #205 | Poor 21.5% |
| Belgians | 16.1 /100 | #206 | Poor 21.5% |
| Ghanaians | 15.7 /100 | #207 | Poor 21.6% |
| Haitians | 15.4 /100 | #208 | Poor 21.6% |
| Immigrants | Eastern Africa | 15.1 /100 | #209 | Poor 21.6% |
| Immigrants | Panama | 14.4 /100 | #210 | Poor 21.6% |
| Icelanders | 14.0 /100 | #211 | Poor 21.6% |
| Jamaicans | 14.0 /100 | #212 | Poor 21.6% |
| Guamanians/Chamorros | 13.7 /100 | #213 | Poor 21.6% |
| Immigrants | Nicaragua | 13.3 /100 | #214 | Poor 21.6% |
Demographics Similar to Immigrants from Northern Africa by Single Female Poverty
In terms of single female poverty, the demographic groups most similar to Immigrants from Northern Africa are Immigrants from Colombia (20.0%, a difference of 0.010%), Immigrants from Zimbabwe (20.0%, a difference of 0.020%), Immigrants from Kazakhstan (20.0%, a difference of 0.040%), Immigrants from Netherlands (20.0%, a difference of 0.070%), and Polish (20.0%, a difference of 0.080%).
| Demographics | Rating | Rank | Single Female Poverty |
| Native Hawaiians | 96.6 /100 | #108 | Exceptional 19.9% |
| Colombians | 96.6 /100 | #109 | Exceptional 19.9% |
| Immigrants | Western Asia | 96.5 /100 | #110 | Exceptional 19.9% |
| Carpatho Rusyns | 96.1 /100 | #111 | Exceptional 20.0% |
| Immigrants | Netherlands | 96.0 /100 | #112 | Exceptional 20.0% |
| Immigrants | Zimbabwe | 95.9 /100 | #113 | Exceptional 20.0% |
| Immigrants | Colombia | 95.9 /100 | #114 | Exceptional 20.0% |
| Immigrants | Northern Africa | 95.8 /100 | #115 | Exceptional 20.0% |
| Immigrants | Kazakhstan | 95.7 /100 | #116 | Exceptional 20.0% |
| Poles | 95.6 /100 | #117 | Exceptional 20.0% |
| Immigrants | Afghanistan | 95.4 /100 | #118 | Exceptional 20.0% |
| Immigrants | Ethiopia | 95.4 /100 | #119 | Exceptional 20.0% |
| South Americans | 95.1 /100 | #120 | Exceptional 20.0% |
| Immigrants | Switzerland | 95.1 /100 | #121 | Exceptional 20.0% |
| Immigrants | South America | 95.0 /100 | #122 | Exceptional 20.0% |