Finnish vs Paraguayan Householder Income Ages 25 - 44 years
COMPARE
Finnish
Paraguayan
Householder Income Ages 25 - 44 years
Householder Income Ages 25 - 44 years Comparison
Finns
Paraguayans
$94,610
HOUSEHOLDER INCOME AGES 25 - 44 YEARS
50.6/ 100
METRIC RATING
173rd/ 347
METRIC RANK
$106,615
HOUSEHOLDER INCOME AGES 25 - 44 YEARS
99.9/ 100
METRIC RATING
54th/ 347
METRIC RANK
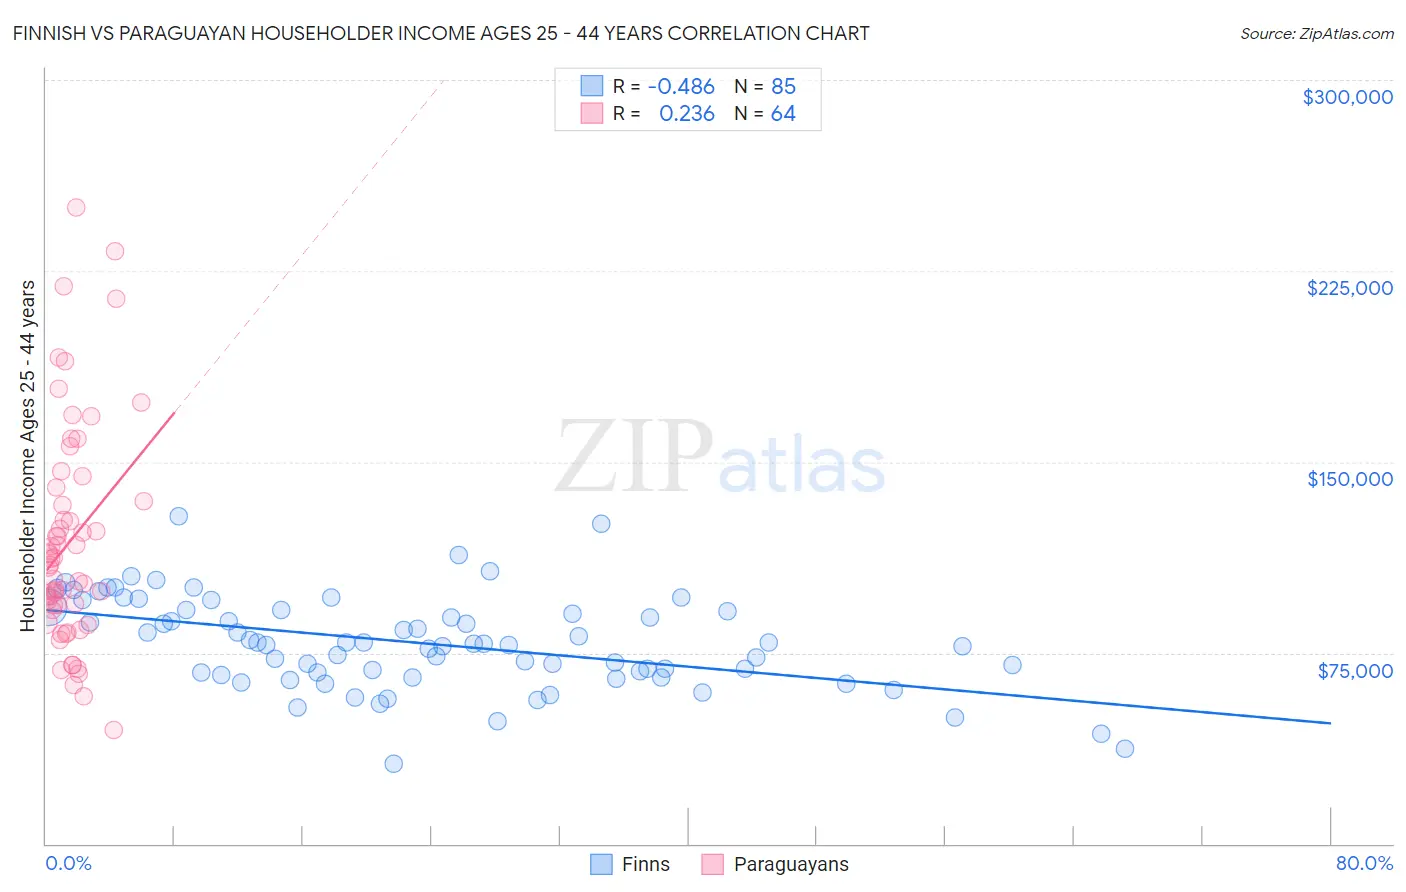
Finnish vs Paraguayan Householder Income Ages 25 - 44 years Correlation Chart
The statistical analysis conducted on geographies consisting of 403,262,071 people shows a moderate negative correlation between the proportion of Finns and household income with householder between the ages 25 and 44 in the United States with a correlation coefficient (R) of -0.486 and weighted average of $94,610. Similarly, the statistical analysis conducted on geographies consisting of 95,064,086 people shows a weak positive correlation between the proportion of Paraguayans and household income with householder between the ages 25 and 44 in the United States with a correlation coefficient (R) of 0.236 and weighted average of $106,615, a difference of 12.7%.
Householder Income Ages 25 - 44 years Correlation Summary
| Measurement | Finnish | Paraguayan |
| Minimum | $31,250 | $44,531 |
| Maximum | $128,513 | $250,001 |
| Range | $97,263 | $205,470 |
| Mean | $78,807 | $118,848 |
| Median | $78,652 | $110,860 |
| Interquartile 25% (IQ1) | $66,639 | $92,713 |
| Interquartile 75% (IQ3) | $91,884 | $137,201 |
| Interquartile Range (IQR) | $25,244 | $44,488 |
| Standard Deviation (Sample) | $18,378 | $43,421 |
| Standard Deviation (Population) | $18,270 | $43,080 |
Similar Demographics by Householder Income Ages 25 - 44 years
Demographics Similar to Finns by Householder Income Ages 25 - 44 years
In terms of householder income ages 25 - 44 years, the demographic groups most similar to Finns are Scottish ($94,622, a difference of 0.010%), Colombian ($94,565, a difference of 0.050%), English ($94,429, a difference of 0.19%), Immigrants ($94,423, a difference of 0.20%), and Immigrants from Armenia ($94,867, a difference of 0.27%).
| Demographics | Rating | Rank | Householder Income Ages 25 - 44 years |
| Immigrants | Ethiopia | 59.5 /100 | #166 | Average $95,256 |
| Czechoslovakians | 57.0 /100 | #167 | Average $95,070 |
| Alsatians | 56.8 /100 | #168 | Average $95,059 |
| Native Hawaiians | 56.8 /100 | #169 | Average $95,058 |
| Slovaks | 56.4 /100 | #170 | Average $95,032 |
| Immigrants | Armenia | 54.2 /100 | #171 | Average $94,867 |
| Scottish | 50.8 /100 | #172 | Average $94,622 |
| Finns | 50.6 /100 | #173 | Average $94,610 |
| Colombians | 50.0 /100 | #174 | Average $94,565 |
| English | 48.1 /100 | #175 | Average $94,429 |
| Immigrants | Immigrants | 48.0 /100 | #176 | Average $94,423 |
| Belgians | 45.8 /100 | #177 | Average $94,262 |
| Immigrants | South America | 42.8 /100 | #178 | Average $94,042 |
| French Canadians | 38.2 /100 | #179 | Fair $93,694 |
| French | 37.8 /100 | #180 | Fair $93,665 |
Demographics Similar to Paraguayans by Householder Income Ages 25 - 44 years
In terms of householder income ages 25 - 44 years, the demographic groups most similar to Paraguayans are Immigrants from Norway ($106,629, a difference of 0.010%), Greek ($106,457, a difference of 0.15%), Immigrants from Europe ($106,817, a difference of 0.19%), Immigrants from Czechoslovakia ($106,888, a difference of 0.26%), and Immigrants from Pakistan ($106,129, a difference of 0.46%).
| Demographics | Rating | Rank | Householder Income Ages 25 - 44 years |
| Estonians | 99.9 /100 | #47 | Exceptional $107,269 |
| Bulgarians | 99.9 /100 | #48 | Exceptional $107,264 |
| Immigrants | Turkey | 99.9 /100 | #49 | Exceptional $107,258 |
| Cambodians | 99.9 /100 | #50 | Exceptional $107,148 |
| Immigrants | Czechoslovakia | 99.9 /100 | #51 | Exceptional $106,888 |
| Immigrants | Europe | 99.9 /100 | #52 | Exceptional $106,817 |
| Immigrants | Norway | 99.9 /100 | #53 | Exceptional $106,629 |
| Paraguayans | 99.9 /100 | #54 | Exceptional $106,615 |
| Greeks | 99.9 /100 | #55 | Exceptional $106,457 |
| Immigrants | Pakistan | 99.8 /100 | #56 | Exceptional $106,129 |
| Immigrants | Austria | 99.8 /100 | #57 | Exceptional $106,103 |
| Immigrants | South Africa | 99.8 /100 | #58 | Exceptional $105,748 |
| Immigrants | Latvia | 99.8 /100 | #59 | Exceptional $105,522 |
| Egyptians | 99.7 /100 | #60 | Exceptional $105,282 |
| Lithuanians | 99.7 /100 | #61 | Exceptional $105,223 |