Finnish vs Paraguayan Single Female Poverty
COMPARE
Finnish
Paraguayan
Single Female Poverty
Single Female Poverty Comparison
Finns
Paraguayans
21.5%
SINGLE FEMALE POVERTY
16.2/ 100
METRIC RATING
205th/ 347
METRIC RANK
19.3%
SINGLE FEMALE POVERTY
99.5/ 100
METRIC RATING
69th/ 347
METRIC RANK
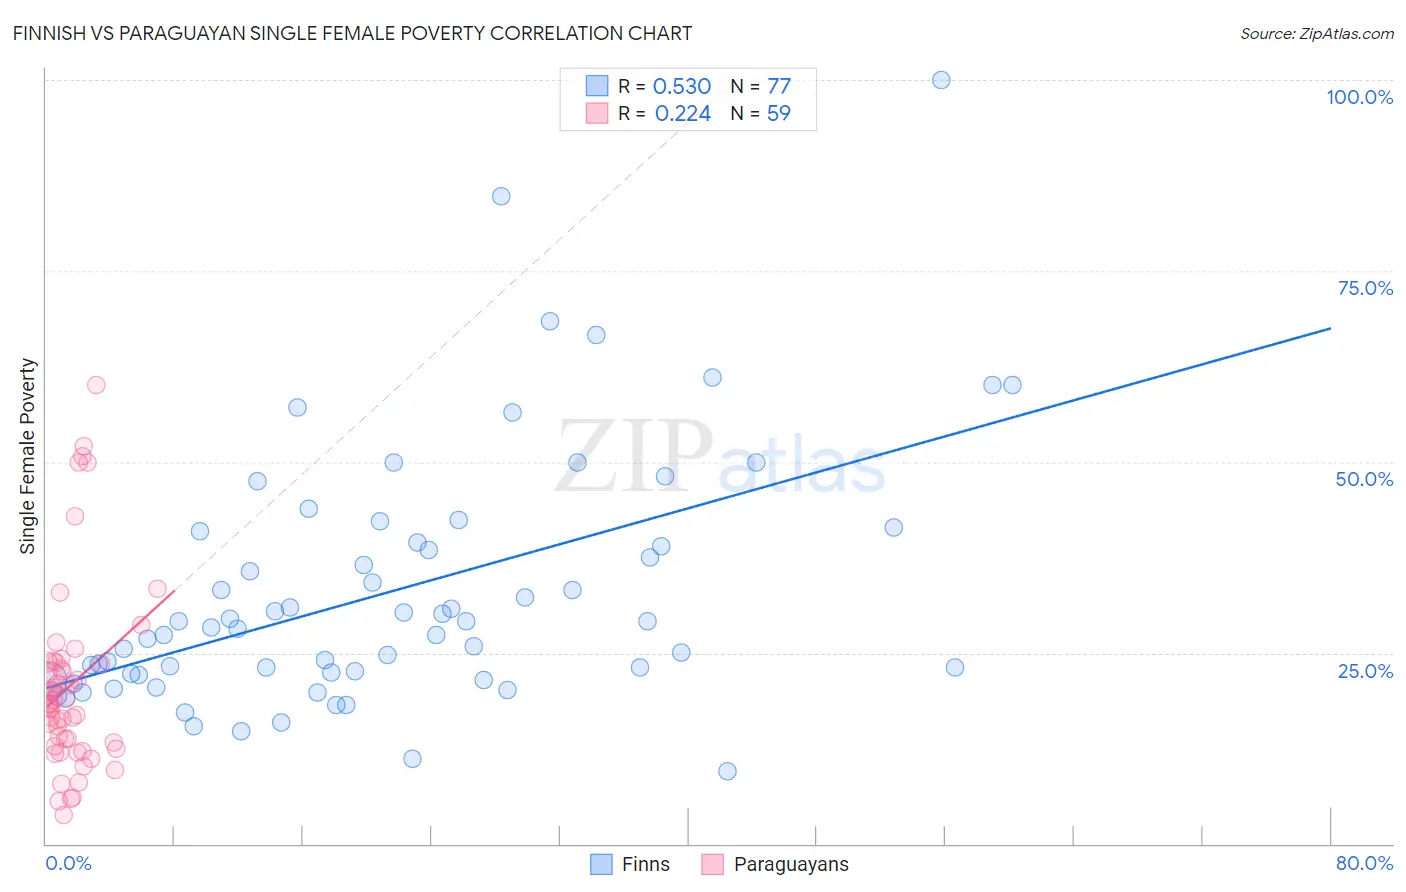
Finnish vs Paraguayan Single Female Poverty Correlation Chart
The statistical analysis conducted on geographies consisting of 396,433,043 people shows a substantial positive correlation between the proportion of Finns and poverty level among single females in the United States with a correlation coefficient (R) of 0.530 and weighted average of 21.5%. Similarly, the statistical analysis conducted on geographies consisting of 94,675,073 people shows a weak positive correlation between the proportion of Paraguayans and poverty level among single females in the United States with a correlation coefficient (R) of 0.224 and weighted average of 19.3%, a difference of 11.6%.
Single Female Poverty Correlation Summary
| Measurement | Finnish | Paraguayan |
| Minimum | 9.5% | 3.7% |
| Maximum | 100.0% | 60.0% |
| Range | 90.5% | 56.3% |
| Mean | 33.0% | 20.7% |
| Median | 28.4% | 18.3% |
| Interquartile 25% (IQ1) | 22.2% | 12.7% |
| Interquartile 75% (IQ3) | 40.2% | 23.7% |
| Interquartile Range (IQR) | 18.0% | 11.0% |
| Standard Deviation (Sample) | 16.5% | 12.1% |
| Standard Deviation (Population) | 16.4% | 12.0% |
Similar Demographics by Single Female Poverty
Demographics Similar to Finns by Single Female Poverty
In terms of single female poverty, the demographic groups most similar to Finns are Belgian (21.5%, a difference of 0.020%), Ghanaian (21.6%, a difference of 0.050%), Immigrants from Africa (21.5%, a difference of 0.060%), Haitian (21.6%, a difference of 0.090%), and Immigrants from Eastern Africa (21.6%, a difference of 0.12%).
| Demographics | Rating | Rank | Single Female Poverty |
| Swiss | 24.2 /100 | #198 | Fair 21.4% |
| Immigrants | Immigrants | 22.0 /100 | #199 | Fair 21.4% |
| Irish | 21.4 /100 | #200 | Fair 21.4% |
| Nigerians | 20.9 /100 | #201 | Fair 21.4% |
| Immigrants | Kenya | 20.7 /100 | #202 | Fair 21.4% |
| Immigrants | Haiti | 18.8 /100 | #203 | Poor 21.5% |
| Immigrants | Africa | 16.7 /100 | #204 | Poor 21.5% |
| Finns | 16.2 /100 | #205 | Poor 21.5% |
| Belgians | 16.1 /100 | #206 | Poor 21.5% |
| Ghanaians | 15.7 /100 | #207 | Poor 21.6% |
| Haitians | 15.4 /100 | #208 | Poor 21.6% |
| Immigrants | Eastern Africa | 15.1 /100 | #209 | Poor 21.6% |
| Immigrants | Panama | 14.4 /100 | #210 | Poor 21.6% |
| Icelanders | 14.0 /100 | #211 | Poor 21.6% |
| Jamaicans | 14.0 /100 | #212 | Poor 21.6% |
Demographics Similar to Paraguayans by Single Female Poverty
In terms of single female poverty, the demographic groups most similar to Paraguayans are Immigrants from Jordan (19.3%, a difference of 0.060%), Immigrants from South Eastern Asia (19.3%, a difference of 0.13%), Immigrants from Latvia (19.3%, a difference of 0.14%), Immigrants from Peru (19.3%, a difference of 0.23%), and Laotian (19.3%, a difference of 0.25%).
| Demographics | Rating | Rank | Single Female Poverty |
| Lithuanians | 99.6 /100 | #62 | Exceptional 19.2% |
| Immigrants | Northern Europe | 99.6 /100 | #63 | Exceptional 19.2% |
| Immigrants | Europe | 99.6 /100 | #64 | Exceptional 19.2% |
| Cypriots | 99.6 /100 | #65 | Exceptional 19.2% |
| Palestinians | 99.6 /100 | #66 | Exceptional 19.2% |
| Immigrants | Egypt | 99.6 /100 | #67 | Exceptional 19.2% |
| Laotians | 99.5 /100 | #68 | Exceptional 19.3% |
| Paraguayans | 99.5 /100 | #69 | Exceptional 19.3% |
| Immigrants | Jordan | 99.4 /100 | #70 | Exceptional 19.3% |
| Immigrants | South Eastern Asia | 99.4 /100 | #71 | Exceptional 19.3% |
| Immigrants | Latvia | 99.4 /100 | #72 | Exceptional 19.3% |
| Immigrants | Peru | 99.4 /100 | #73 | Exceptional 19.3% |
| Immigrants | Belarus | 99.4 /100 | #74 | Exceptional 19.3% |
| Immigrants | Turkey | 99.4 /100 | #75 | Exceptional 19.4% |
| Peruvians | 99.4 /100 | #76 | Exceptional 19.4% |