Trinidadian and Tobagonian vs Paraguayan Married-Couple Family Poverty
COMPARE
Trinidadian and Tobagonian
Paraguayan
Married-Couple Family Poverty
Married-Couple Family Poverty Comparison
Trinidadians and Tobagonians
Paraguayans
6.2%
MARRIED-COUPLE FAMILY POVERTY
0.1/ 100
METRIC RATING
272nd/ 347
METRIC RANK
5.1%
MARRIED-COUPLE FAMILY POVERTY
61.5/ 100
METRIC RATING
166th/ 347
METRIC RANK
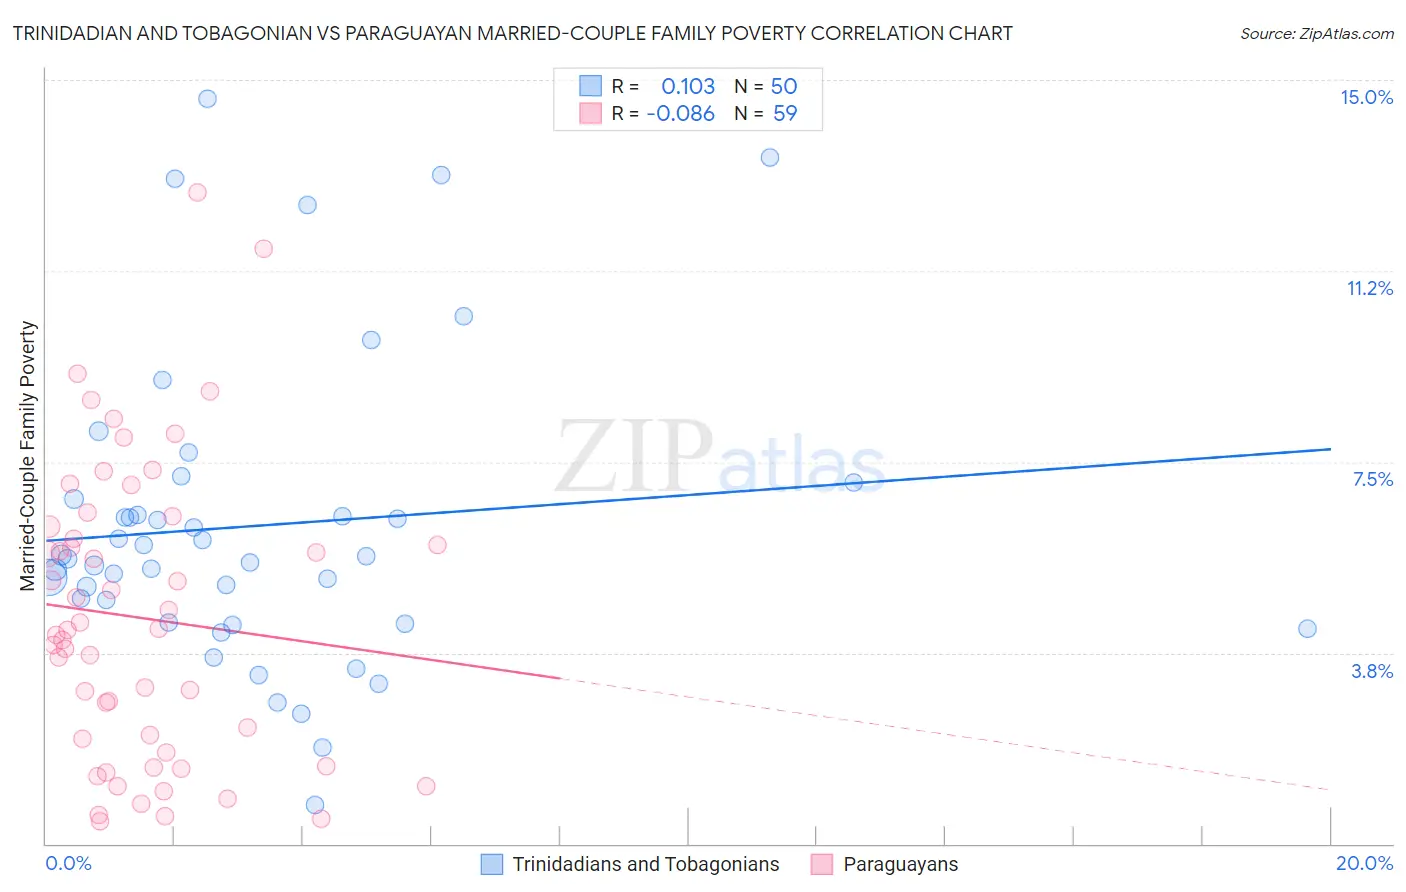
Trinidadian and Tobagonian vs Paraguayan Married-Couple Family Poverty Correlation Chart
The statistical analysis conducted on geographies consisting of 218,634,387 people shows a poor positive correlation between the proportion of Trinidadians and Tobagonians and poverty level among married-couple families in the United States with a correlation coefficient (R) of 0.103 and weighted average of 6.2%. Similarly, the statistical analysis conducted on geographies consisting of 94,718,815 people shows a slight negative correlation between the proportion of Paraguayans and poverty level among married-couple families in the United States with a correlation coefficient (R) of -0.086 and weighted average of 5.1%, a difference of 21.1%.
Married-Couple Family Poverty Correlation Summary
| Measurement | Trinidadian and Tobagonian | Paraguayan |
| Minimum | 0.75% | 0.45% |
| Maximum | 14.6% | 12.8% |
| Range | 13.9% | 12.3% |
| Mean | 6.3% | 4.4% |
| Median | 5.6% | 4.2% |
| Interquartile 25% (IQ1) | 4.3% | 1.8% |
| Interquartile 75% (IQ3) | 6.8% | 6.2% |
| Interquartile Range (IQR) | 2.4% | 4.4% |
| Standard Deviation (Sample) | 3.0% | 2.9% |
| Standard Deviation (Population) | 3.0% | 2.9% |
Similar Demographics by Married-Couple Family Poverty
Demographics Similar to Trinidadians and Tobagonians by Married-Couple Family Poverty
In terms of married-couple family poverty, the demographic groups most similar to Trinidadians and Tobagonians are Immigrants from Bahamas (6.2%, a difference of 0.030%), Immigrants from Jamaica (6.2%, a difference of 0.25%), Immigrants from West Indies (6.2%, a difference of 0.29%), Alaska Native (6.2%, a difference of 0.46%), and Colville (6.3%, a difference of 0.78%).
| Demographics | Rating | Rank | Married-Couple Family Poverty |
| Blackfeet | 0.2 /100 | #265 | Tragic 6.2% |
| Creek | 0.2 /100 | #266 | Tragic 6.2% |
| Spanish Americans | 0.2 /100 | #267 | Tragic 6.2% |
| Alaska Natives | 0.2 /100 | #268 | Tragic 6.2% |
| Immigrants | West Indies | 0.1 /100 | #269 | Tragic 6.2% |
| Immigrants | Jamaica | 0.1 /100 | #270 | Tragic 6.2% |
| Immigrants | Bahamas | 0.1 /100 | #271 | Tragic 6.2% |
| Trinidadians and Tobagonians | 0.1 /100 | #272 | Tragic 6.2% |
| Colville | 0.1 /100 | #273 | Tragic 6.3% |
| Barbadians | 0.1 /100 | #274 | Tragic 6.3% |
| Choctaw | 0.1 /100 | #275 | Tragic 6.3% |
| Yaqui | 0.1 /100 | #276 | Tragic 6.3% |
| Indonesians | 0.1 /100 | #277 | Tragic 6.3% |
| Immigrants | Trinidad and Tobago | 0.1 /100 | #278 | Tragic 6.4% |
| Houma | 0.0 /100 | #279 | Tragic 6.4% |
Demographics Similar to Paraguayans by Married-Couple Family Poverty
In terms of married-couple family poverty, the demographic groups most similar to Paraguayans are Costa Rican (5.1%, a difference of 0.0%), Immigrants from Malaysia (5.1%, a difference of 0.090%), Hawaiian (5.1%, a difference of 0.10%), Sierra Leonean (5.1%, a difference of 0.34%), and Immigrants from Jordan (5.1%, a difference of 0.65%).
| Demographics | Rating | Rank | Married-Couple Family Poverty |
| Immigrants | Saudi Arabia | 70.3 /100 | #159 | Good 5.1% |
| Pennsylvania Germans | 68.5 /100 | #160 | Good 5.1% |
| Ethiopians | 68.1 /100 | #161 | Good 5.1% |
| Immigrants | Jordan | 66.5 /100 | #162 | Good 5.1% |
| Sierra Leoneans | 64.1 /100 | #163 | Good 5.1% |
| Hawaiians | 62.3 /100 | #164 | Good 5.1% |
| Immigrants | Malaysia | 62.2 /100 | #165 | Good 5.1% |
| Paraguayans | 61.5 /100 | #166 | Good 5.1% |
| Costa Ricans | 61.5 /100 | #167 | Good 5.1% |
| Immigrants | Uganda | 54.9 /100 | #168 | Average 5.2% |
| Ottawa | 54.5 /100 | #169 | Average 5.2% |
| Immigrants | Argentina | 54.4 /100 | #170 | Average 5.2% |
| Bermudans | 52.9 /100 | #171 | Average 5.2% |
| Immigrants | Northern Africa | 51.3 /100 | #172 | Average 5.2% |
| Alsatians | 51.2 /100 | #173 | Average 5.2% |