Finnish vs Paraguayan Disability Age 18 to 34
COMPARE
Finnish
Paraguayan
Disability Age 18 to 34
Disability Age 18 to 34 Comparison
Finns
Paraguayans
7.8%
DISABILITY AGE 18 TO 34
0.0/ 100
METRIC RATING
310th/ 347
METRIC RANK
5.9%
DISABILITY AGE 18 TO 34
99.7/ 100
METRIC RATING
56th/ 347
METRIC RANK
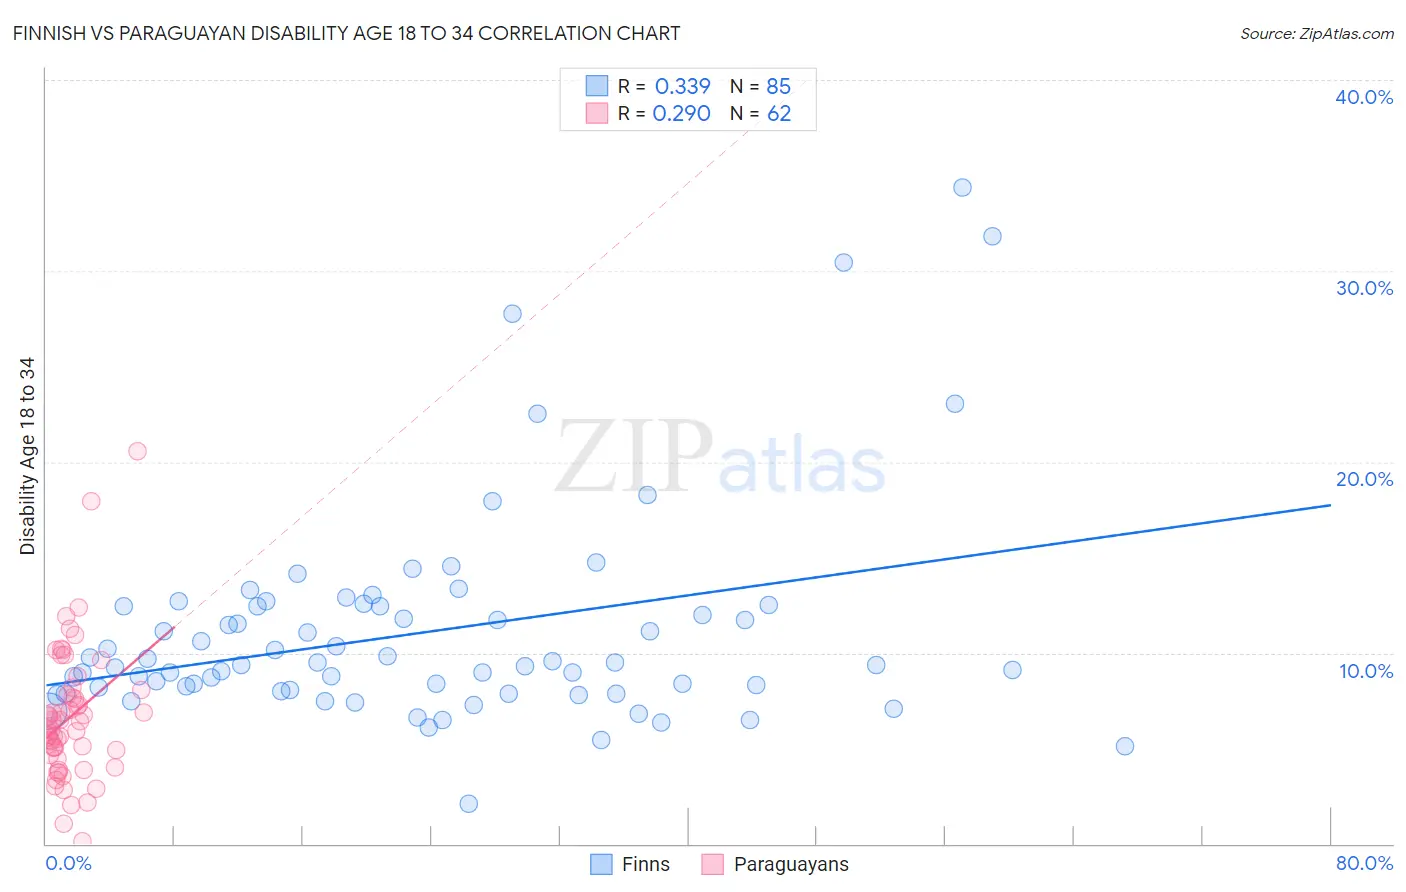
Finnish vs Paraguayan Disability Age 18 to 34 Correlation Chart
The statistical analysis conducted on geographies consisting of 403,137,976 people shows a mild positive correlation between the proportion of Finns and percentage of population with a disability between the ages 18 and 35 in the United States with a correlation coefficient (R) of 0.339 and weighted average of 7.8%. Similarly, the statistical analysis conducted on geographies consisting of 95,068,899 people shows a weak positive correlation between the proportion of Paraguayans and percentage of population with a disability between the ages 18 and 35 in the United States with a correlation coefficient (R) of 0.290 and weighted average of 5.9%, a difference of 31.6%.
Disability Age 18 to 34 Correlation Summary
| Measurement | Finnish | Paraguayan |
| Minimum | 2.1% | 0.13% |
| Maximum | 34.4% | 20.6% |
| Range | 32.3% | 20.5% |
| Mean | 11.1% | 6.6% |
| Median | 9.4% | 6.0% |
| Interquartile 25% (IQ1) | 8.0% | 4.6% |
| Interquartile 75% (IQ3) | 12.4% | 7.8% |
| Interquartile Range (IQR) | 4.4% | 3.1% |
| Standard Deviation (Sample) | 5.6% | 3.5% |
| Standard Deviation (Population) | 5.6% | 3.5% |
Similar Demographics by Disability Age 18 to 34
Demographics Similar to Finns by Disability Age 18 to 34
In terms of disability age 18 to 34, the demographic groups most similar to Finns are Alaska Native (7.8%, a difference of 0.060%), Pennsylvania German (7.8%, a difference of 0.070%), Scotch-Irish (7.8%, a difference of 0.10%), English (7.8%, a difference of 0.35%), and Menominee (7.8%, a difference of 0.44%).
| Demographics | Rating | Rank | Disability Age 18 to 34 |
| Cheyenne | 0.0 /100 | #303 | Tragic 7.7% |
| Shoshone | 0.0 /100 | #304 | Tragic 7.8% |
| Menominee | 0.0 /100 | #305 | Tragic 7.8% |
| English | 0.0 /100 | #306 | Tragic 7.8% |
| Scotch-Irish | 0.0 /100 | #307 | Tragic 7.8% |
| Pennsylvania Germans | 0.0 /100 | #308 | Tragic 7.8% |
| Alaska Natives | 0.0 /100 | #309 | Tragic 7.8% |
| Finns | 0.0 /100 | #310 | Tragic 7.8% |
| French | 0.0 /100 | #311 | Tragic 7.9% |
| Spanish Americans | 0.0 /100 | #312 | Tragic 7.9% |
| Iroquois | 0.0 /100 | #313 | Tragic 7.9% |
| Colville | 0.0 /100 | #314 | Tragic 7.9% |
| Americans | 0.0 /100 | #315 | Tragic 8.0% |
| Puerto Ricans | 0.0 /100 | #316 | Tragic 8.0% |
| Hmong | 0.0 /100 | #317 | Tragic 8.1% |
Demographics Similar to Paraguayans by Disability Age 18 to 34
In terms of disability age 18 to 34, the demographic groups most similar to Paraguayans are Immigrants from Haiti (5.9%, a difference of 0.11%), Immigrants from Serbia (5.9%, a difference of 0.13%), Immigrants from Spain (5.9%, a difference of 0.16%), Immigrants from Malaysia (5.9%, a difference of 0.17%), and Immigrants from Indonesia (5.9%, a difference of 0.22%).
| Demographics | Rating | Rank | Disability Age 18 to 34 |
| Immigrants | Belarus | 99.8 /100 | #49 | Exceptional 5.9% |
| Immigrants | El Salvador | 99.8 /100 | #50 | Exceptional 5.9% |
| Egyptians | 99.8 /100 | #51 | Exceptional 5.9% |
| Okinawans | 99.7 /100 | #52 | Exceptional 5.9% |
| Immigrants | Indonesia | 99.7 /100 | #53 | Exceptional 5.9% |
| Immigrants | Malaysia | 99.7 /100 | #54 | Exceptional 5.9% |
| Immigrants | Spain | 99.7 /100 | #55 | Exceptional 5.9% |
| Paraguayans | 99.7 /100 | #56 | Exceptional 5.9% |
| Immigrants | Haiti | 99.7 /100 | #57 | Exceptional 5.9% |
| Immigrants | Serbia | 99.7 /100 | #58 | Exceptional 5.9% |
| Immigrants | Caribbean | 99.6 /100 | #59 | Exceptional 6.0% |
| Immigrants | Sri Lanka | 99.6 /100 | #60 | Exceptional 6.0% |
| British West Indians | 99.6 /100 | #61 | Exceptional 6.0% |
| Peruvians | 99.6 /100 | #62 | Exceptional 6.0% |
| Salvadorans | 99.6 /100 | #63 | Exceptional 6.0% |