Serbian vs Estonian Married-Couple Family Poverty
COMPARE
Serbian
Estonian
Married-Couple Family Poverty
Married-Couple Family Poverty Comparison
Serbians
Estonians
4.3%
MARRIED-COUPLE FAMILY POVERTY
99.8/ 100
METRIC RATING
45th/ 347
METRIC RANK
4.2%
MARRIED-COUPLE FAMILY POVERTY
99.9/ 100
METRIC RATING
31st/ 347
METRIC RANK
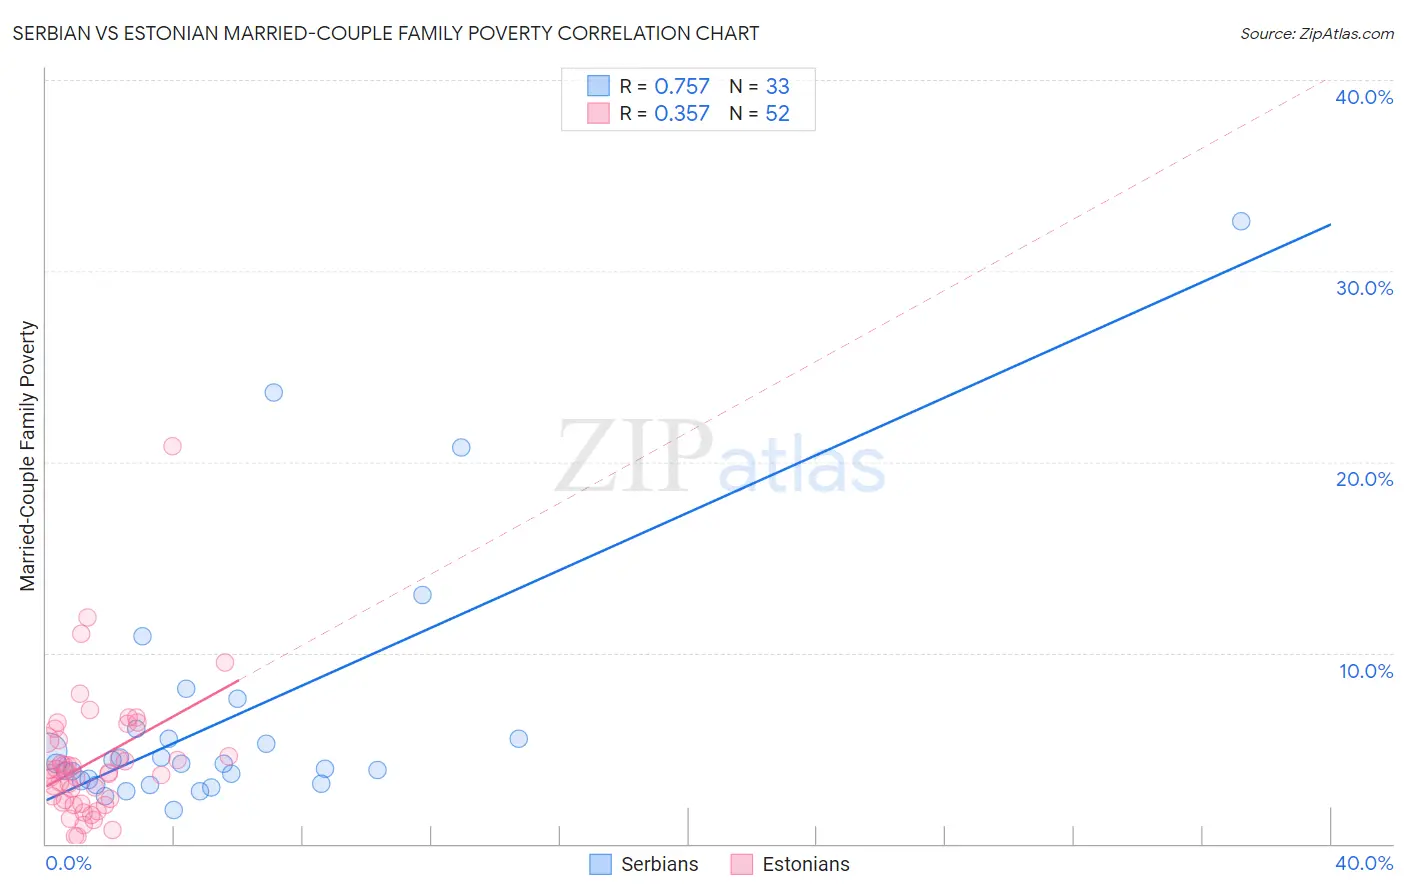
Serbian vs Estonian Married-Couple Family Poverty Correlation Chart
The statistical analysis conducted on geographies consisting of 265,760,862 people shows a strong positive correlation between the proportion of Serbians and poverty level among married-couple families in the United States with a correlation coefficient (R) of 0.757 and weighted average of 4.3%. Similarly, the statistical analysis conducted on geographies consisting of 123,069,874 people shows a mild positive correlation between the proportion of Estonians and poverty level among married-couple families in the United States with a correlation coefficient (R) of 0.357 and weighted average of 4.2%, a difference of 3.3%.
Married-Couple Family Poverty Correlation Summary
| Measurement | Serbian | Estonian |
| Minimum | 1.8% | 0.39% |
| Maximum | 32.6% | 20.8% |
| Range | 30.8% | 20.5% |
| Mean | 6.6% | 4.3% |
| Median | 4.2% | 3.7% |
| Interquartile 25% (IQ1) | 3.2% | 2.2% |
| Interquartile 75% (IQ3) | 5.8% | 5.4% |
| Interquartile Range (IQR) | 2.5% | 3.2% |
| Standard Deviation (Sample) | 6.7% | 3.4% |
| Standard Deviation (Population) | 6.6% | 3.4% |
Demographics Similar to Serbians and Estonians by Married-Couple Family Poverty
In terms of married-couple family poverty, the demographic groups most similar to Serbians are Immigrants from Japan (4.3%, a difference of 0.020%), British (4.3%, a difference of 0.030%), Immigrants from South Central Asia (4.3%, a difference of 0.14%), Australian (4.3%, a difference of 0.21%), and Swiss (4.3%, a difference of 0.39%). Similarly, the demographic groups most similar to Estonians are Finnish (4.2%, a difference of 0.080%), Greek (4.2%, a difference of 0.11%), Immigrants from Scotland (4.2%, a difference of 0.32%), Scandinavian (4.1%, a difference of 0.36%), and Irish (4.2%, a difference of 0.59%).
| Demographics | Rating | Rank | Married-Couple Family Poverty |
| Scandinavians | 99.9 /100 | #28 | Exceptional 4.1% |
| Immigrants | Scotland | 99.9 /100 | #29 | Exceptional 4.2% |
| Finns | 99.9 /100 | #30 | Exceptional 4.2% |
| Estonians | 99.9 /100 | #31 | Exceptional 4.2% |
| Greeks | 99.9 /100 | #32 | Exceptional 4.2% |
| Irish | 99.9 /100 | #33 | Exceptional 4.2% |
| Dutch | 99.9 /100 | #34 | Exceptional 4.2% |
| Europeans | 99.9 /100 | #35 | Exceptional 4.2% |
| English | 99.9 /100 | #36 | Exceptional 4.2% |
| Iranians | 99.9 /100 | #37 | Exceptional 4.2% |
| Belgians | 99.9 /100 | #38 | Exceptional 4.2% |
| Immigrants | Northern Europe | 99.8 /100 | #39 | Exceptional 4.2% |
| French Canadians | 99.8 /100 | #40 | Exceptional 4.2% |
| Northern Europeans | 99.8 /100 | #41 | Exceptional 4.3% |
| Scottish | 99.8 /100 | #42 | Exceptional 4.3% |
| Swiss | 99.8 /100 | #43 | Exceptional 4.3% |
| Immigrants | Japan | 99.8 /100 | #44 | Exceptional 4.3% |
| Serbians | 99.8 /100 | #45 | Exceptional 4.3% |
| British | 99.8 /100 | #46 | Exceptional 4.3% |
| Immigrants | South Central Asia | 99.8 /100 | #47 | Exceptional 4.3% |
| Australians | 99.7 /100 | #48 | Exceptional 4.3% |