Zip Codes with the Highest Percentage of Population Employed in Community & Social Service in Bethlehem, PA
RELATED REPORTS & OPTIONS
Community & Social Service
Bethlehem
Compare Zip Codes
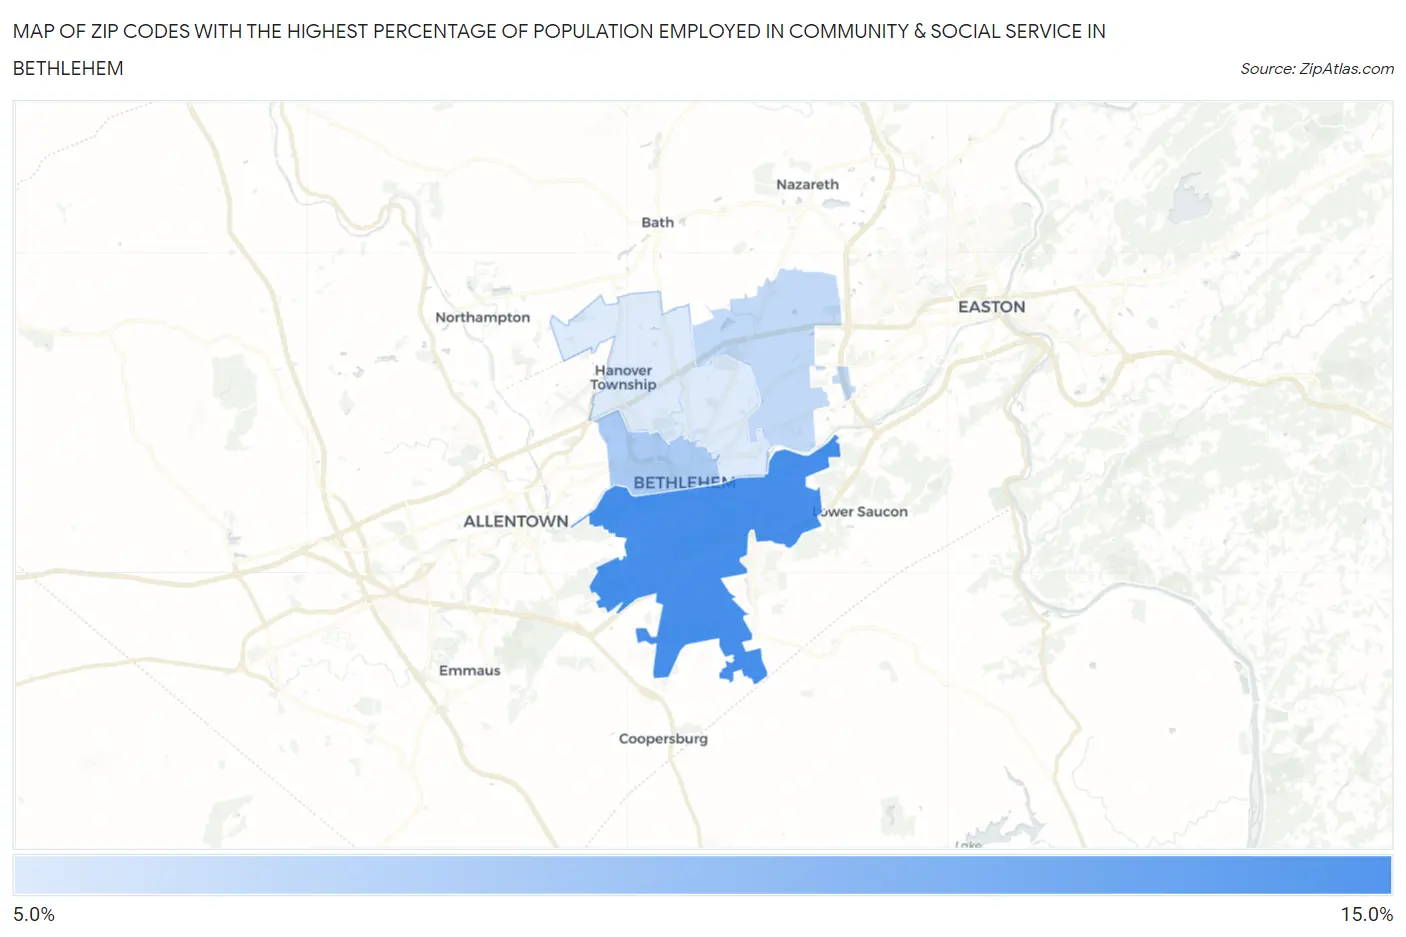
Map of Zip Codes with the Highest Percentage of Population Employed in Community & Social Service in Bethlehem
11.2%
14.9%
Zip Codes with the Highest Percentage of Population Employed in Community & Social Service in Bethlehem, PA
| Zip Code | % Employed | vs State | vs National | |
| 1. | 18015 | 14.9% | 11.2%(+3.69)#219 | 11.2%(+3.65)#5,095 |
| 2. | 18018 | 12.4% | 11.2%(+1.23)#357 | 11.2%(+1.19)#8,589 |
| 3. | 18020 | 11.8% | 11.2%(+0.654)#413 | 11.2%(+0.616)#9,699 |
| 4. | 18017 | 11.2% | 11.2%(-0.008)#502 | 11.2%(-0.046)#11,210 |
1
Common Questions
What are the Top 3 Zip Codes with the Highest Percentage of Population Employed in Community & Social Service in Bethlehem, PA?
Top 3 Zip Codes with the Highest Percentage of Population Employed in Community & Social Service in Bethlehem, PA are:
What zip code has the Highest Percentage of Population Employed in Community & Social Service in Bethlehem, PA?
18015 has the Highest Percentage of Population Employed in Community & Social Service in Bethlehem, PA with 14.9%.
What is the Percentage of Population Employed in Community & Social Service in Bethlehem, PA?
Percentage of Population Employed in Community & Social Service in Bethlehem is 12.4%.
What is the Percentage of Population Employed in Community & Social Service in Pennsylvania?
Percentage of Population Employed in Community & Social Service in Pennsylvania is 11.2%.
What is the Percentage of Population Employed in Community & Social Service in the United States?
Percentage of Population Employed in Community & Social Service in the United States is 11.2%.