Tlingit-Haida vs Central American Median Household Income
COMPARE
Tlingit-Haida
Central American
Median Household Income
Median Household Income Comparison
Tlingit-Haida
Central Americans
$83,968
MEDIAN HOUSEHOLD INCOME
32.6/ 100
METRIC RATING
188th/ 347
METRIC RANK
$78,803
MEDIAN HOUSEHOLD INCOME
1.7/ 100
METRIC RATING
246th/ 347
METRIC RANK
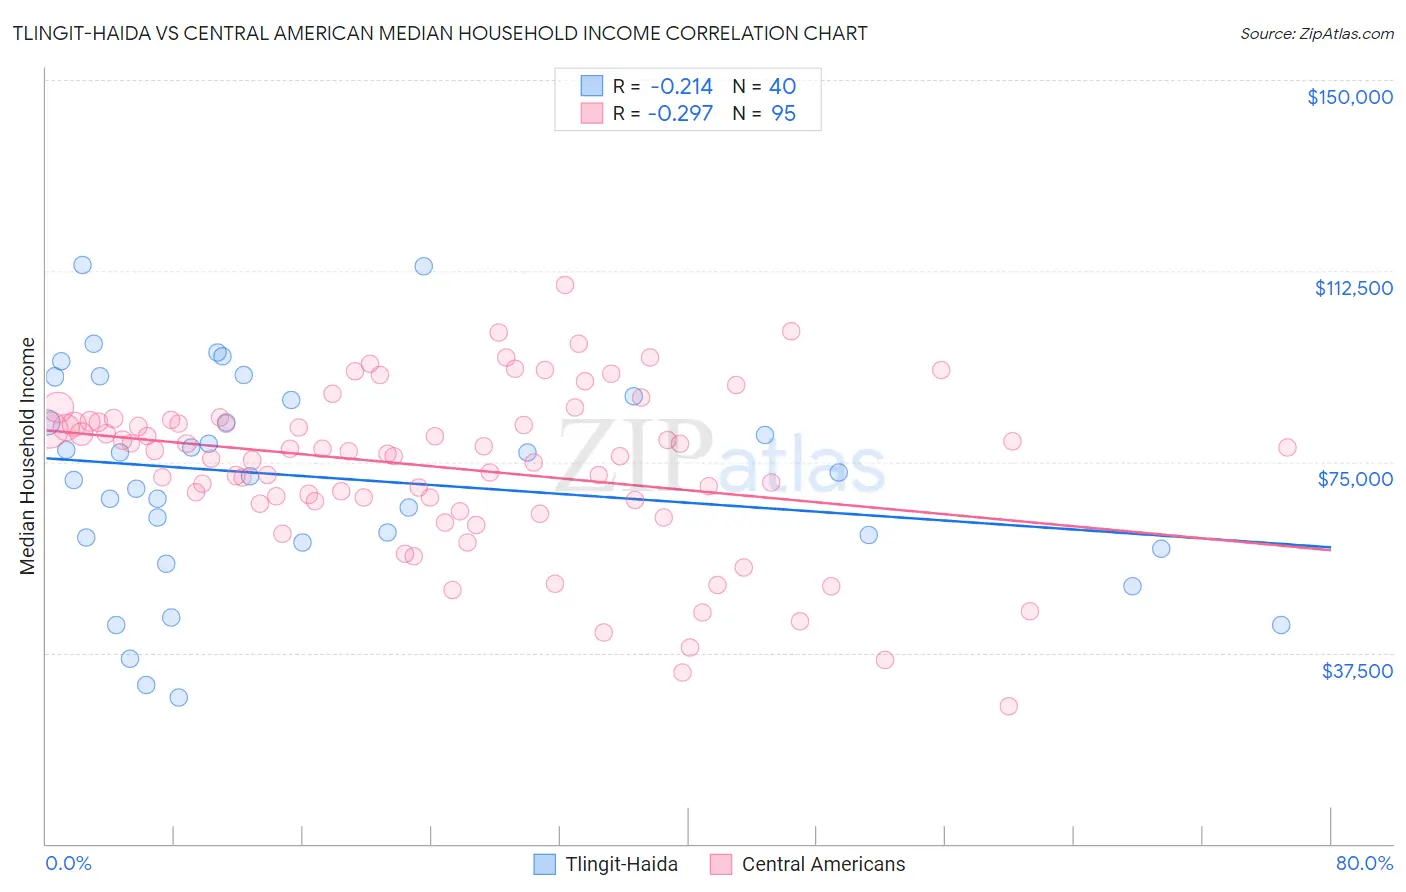
Tlingit-Haida vs Central American Median Household Income Correlation Chart
The statistical analysis conducted on geographies consisting of 60,854,436 people shows a weak negative correlation between the proportion of Tlingit-Haida and median household income in the United States with a correlation coefficient (R) of -0.214 and weighted average of $83,968. Similarly, the statistical analysis conducted on geographies consisting of 503,881,037 people shows a weak negative correlation between the proportion of Central Americans and median household income in the United States with a correlation coefficient (R) of -0.297 and weighted average of $78,803, a difference of 6.6%.
Median Household Income Correlation Summary
| Measurement | Tlingit-Haida | Central American |
| Minimum | $28,750 | $26,979 |
| Maximum | $113,574 | $109,623 |
| Range | $84,824 | $82,644 |
| Mean | $71,962 | $73,852 |
| Median | $72,542 | $77,087 |
| Interquartile 25% (IQ1) | $59,644 | $67,287 |
| Interquartile 75% (IQ3) | $87,562 | $82,754 |
| Interquartile Range (IQR) | $27,918 | $15,467 |
| Standard Deviation (Sample) | $20,793 | $15,929 |
| Standard Deviation (Population) | $20,531 | $15,845 |
Similar Demographics by Median Household Income
Demographics Similar to Tlingit-Haida by Median Household Income
In terms of median household income, the demographic groups most similar to Tlingit-Haida are Puget Sound Salish ($84,011, a difference of 0.050%), Belgian ($84,008, a difference of 0.050%), Immigrants from Colombia ($83,902, a difference of 0.080%), Kenyan ($84,085, a difference of 0.14%), and Slovak ($83,798, a difference of 0.20%).
| Demographics | Rating | Rank | Median Household Income |
| Hawaiians | 44.1 /100 | #181 | Average $84,729 |
| Uruguayans | 43.5 /100 | #182 | Average $84,691 |
| Spaniards | 42.7 /100 | #183 | Average $84,644 |
| Immigrants | Eastern Africa | 37.4 /100 | #184 | Fair $84,299 |
| Kenyans | 34.2 /100 | #185 | Fair $84,085 |
| Puget Sound Salish | 33.2 /100 | #186 | Fair $84,011 |
| Belgians | 33.2 /100 | #187 | Fair $84,008 |
| Tlingit-Haida | 32.6 /100 | #188 | Fair $83,968 |
| Immigrants | Colombia | 31.7 /100 | #189 | Fair $83,902 |
| Slovaks | 30.2 /100 | #190 | Fair $83,798 |
| Iraqis | 29.6 /100 | #191 | Fair $83,753 |
| Welsh | 28.0 /100 | #192 | Fair $83,628 |
| Finns | 27.7 /100 | #193 | Fair $83,607 |
| Ghanaians | 27.4 /100 | #194 | Fair $83,582 |
| Immigrants | Armenia | 27.0 /100 | #195 | Fair $83,555 |
Demographics Similar to Central Americans by Median Household Income
In terms of median household income, the demographic groups most similar to Central Americans are Inupiat ($78,841, a difference of 0.050%), Immigrants from Burma/Myanmar ($78,682, a difference of 0.15%), Marshallese ($78,930, a difference of 0.16%), Immigrants from Barbados ($78,989, a difference of 0.24%), and Sudanese ($78,529, a difference of 0.35%).
| Demographics | Rating | Rank | Median Household Income |
| Alaska Natives | 2.7 /100 | #239 | Tragic $79,509 |
| Immigrants | Western Africa | 2.7 /100 | #240 | Tragic $79,490 |
| Immigrants | Nonimmigrants | 2.6 /100 | #241 | Tragic $79,429 |
| Immigrants | Sudan | 2.1 /100 | #242 | Tragic $79,103 |
| Immigrants | Barbados | 1.9 /100 | #243 | Tragic $78,989 |
| Marshallese | 1.9 /100 | #244 | Tragic $78,930 |
| Inupiat | 1.8 /100 | #245 | Tragic $78,841 |
| Central Americans | 1.7 /100 | #246 | Tragic $78,803 |
| Immigrants | Burma/Myanmar | 1.6 /100 | #247 | Tragic $78,682 |
| Sudanese | 1.5 /100 | #248 | Tragic $78,529 |
| West Indians | 1.4 /100 | #249 | Tragic $78,455 |
| Immigrants | Laos | 1.3 /100 | #250 | Tragic $78,327 |
| Mexican American Indians | 1.2 /100 | #251 | Tragic $78,166 |
| Immigrants | West Indies | 1.0 /100 | #252 | Tragic $77,956 |
| Immigrants | St. Vincent and the Grenadines | 0.9 /100 | #253 | Tragic $77,690 |