Tlingit-Haida vs Immigrants from Hong Kong Median Household Income
COMPARE
Tlingit-Haida
Immigrants from Hong Kong
Median Household Income
Median Household Income Comparison
Tlingit-Haida
Immigrants from Hong Kong
$83,968
MEDIAN HOUSEHOLD INCOME
32.6/ 100
METRIC RATING
188th/ 347
METRIC RANK
$111,519
MEDIAN HOUSEHOLD INCOME
100.0/ 100
METRIC RATING
4th/ 347
METRIC RANK
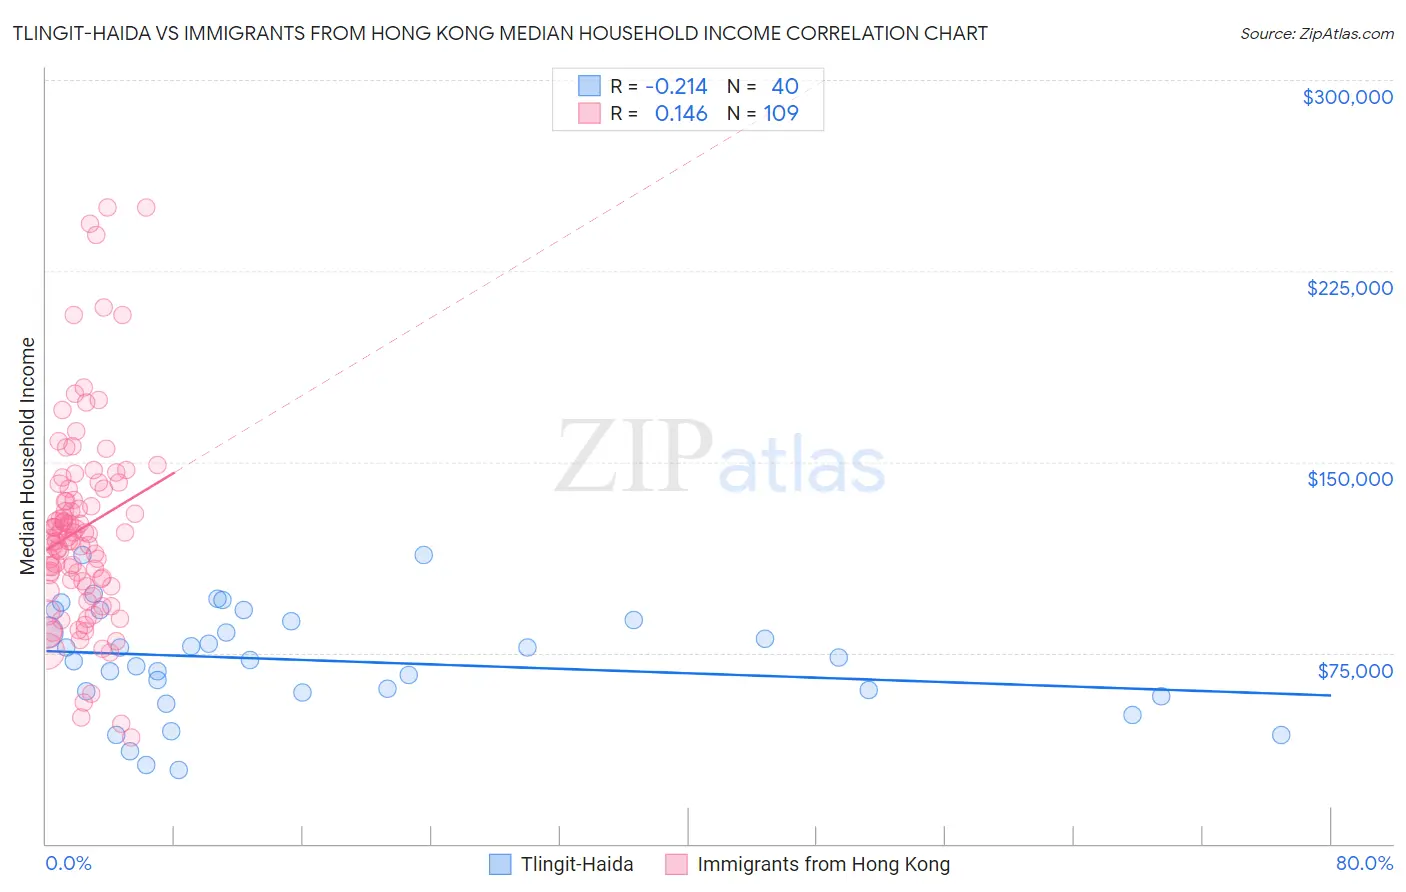
Tlingit-Haida vs Immigrants from Hong Kong Median Household Income Correlation Chart
The statistical analysis conducted on geographies consisting of 60,854,436 people shows a weak negative correlation between the proportion of Tlingit-Haida and median household income in the United States with a correlation coefficient (R) of -0.214 and weighted average of $83,968. Similarly, the statistical analysis conducted on geographies consisting of 253,858,060 people shows a poor positive correlation between the proportion of Immigrants from Hong Kong and median household income in the United States with a correlation coefficient (R) of 0.146 and weighted average of $111,519, a difference of 32.8%.
Median Household Income Correlation Summary
| Measurement | Tlingit-Haida | Immigrants from Hong Kong |
| Minimum | $28,750 | $41,563 |
| Maximum | $113,574 | $250,001 |
| Range | $84,824 | $208,438 |
| Mean | $71,962 | $123,651 |
| Median | $72,542 | $120,226 |
| Interquartile 25% (IQ1) | $59,644 | $102,101 |
| Interquartile 75% (IQ3) | $87,562 | $139,539 |
| Interquartile Range (IQR) | $27,918 | $37,437 |
| Standard Deviation (Sample) | $20,793 | $39,253 |
| Standard Deviation (Population) | $20,531 | $39,072 |
Similar Demographics by Median Household Income
Demographics Similar to Tlingit-Haida by Median Household Income
In terms of median household income, the demographic groups most similar to Tlingit-Haida are Puget Sound Salish ($84,011, a difference of 0.050%), Belgian ($84,008, a difference of 0.050%), Immigrants from Colombia ($83,902, a difference of 0.080%), Kenyan ($84,085, a difference of 0.14%), and Slovak ($83,798, a difference of 0.20%).
| Demographics | Rating | Rank | Median Household Income |
| Hawaiians | 44.1 /100 | #181 | Average $84,729 |
| Uruguayans | 43.5 /100 | #182 | Average $84,691 |
| Spaniards | 42.7 /100 | #183 | Average $84,644 |
| Immigrants | Eastern Africa | 37.4 /100 | #184 | Fair $84,299 |
| Kenyans | 34.2 /100 | #185 | Fair $84,085 |
| Puget Sound Salish | 33.2 /100 | #186 | Fair $84,011 |
| Belgians | 33.2 /100 | #187 | Fair $84,008 |
| Tlingit-Haida | 32.6 /100 | #188 | Fair $83,968 |
| Immigrants | Colombia | 31.7 /100 | #189 | Fair $83,902 |
| Slovaks | 30.2 /100 | #190 | Fair $83,798 |
| Iraqis | 29.6 /100 | #191 | Fair $83,753 |
| Welsh | 28.0 /100 | #192 | Fair $83,628 |
| Finns | 27.7 /100 | #193 | Fair $83,607 |
| Ghanaians | 27.4 /100 | #194 | Fair $83,582 |
| Immigrants | Armenia | 27.0 /100 | #195 | Fair $83,555 |
Demographics Similar to Immigrants from Hong Kong by Median Household Income
In terms of median household income, the demographic groups most similar to Immigrants from Hong Kong are Thai ($110,648, a difference of 0.79%), Immigrants from Singapore ($110,428, a difference of 0.99%), Immigrants from India ($113,009, a difference of 1.3%), Iranian ($109,835, a difference of 1.5%), and Immigrants from Iran ($108,055, a difference of 3.2%).
| Demographics | Rating | Rank | Median Household Income |
| Immigrants | Taiwan | 100.0 /100 | #1 | Exceptional $116,460 |
| Filipinos | 100.0 /100 | #2 | Exceptional $115,509 |
| Immigrants | India | 100.0 /100 | #3 | Exceptional $113,009 |
| Immigrants | Hong Kong | 100.0 /100 | #4 | Exceptional $111,519 |
| Thais | 100.0 /100 | #5 | Exceptional $110,648 |
| Immigrants | Singapore | 100.0 /100 | #6 | Exceptional $110,428 |
| Iranians | 100.0 /100 | #7 | Exceptional $109,835 |
| Immigrants | Iran | 100.0 /100 | #8 | Exceptional $108,055 |
| Okinawans | 100.0 /100 | #9 | Exceptional $106,624 |
| Immigrants | South Central Asia | 100.0 /100 | #10 | Exceptional $106,057 |
| Immigrants | China | 100.0 /100 | #11 | Exceptional $105,335 |
| Indians (Asian) | 100.0 /100 | #12 | Exceptional $105,262 |
| Immigrants | Eastern Asia | 100.0 /100 | #13 | Exceptional $104,796 |
| Immigrants | Ireland | 100.0 /100 | #14 | Exceptional $104,692 |
| Immigrants | Israel | 100.0 /100 | #15 | Exceptional $104,090 |