Tlingit-Haida vs Puget Sound Salish Median Household Income
COMPARE
Tlingit-Haida
Puget Sound Salish
Median Household Income
Median Household Income Comparison
Tlingit-Haida
Puget Sound Salish
$83,968
MEDIAN HOUSEHOLD INCOME
32.6/ 100
METRIC RATING
188th/ 347
METRIC RANK
$84,011
MEDIAN HOUSEHOLD INCOME
33.2/ 100
METRIC RATING
186th/ 347
METRIC RANK
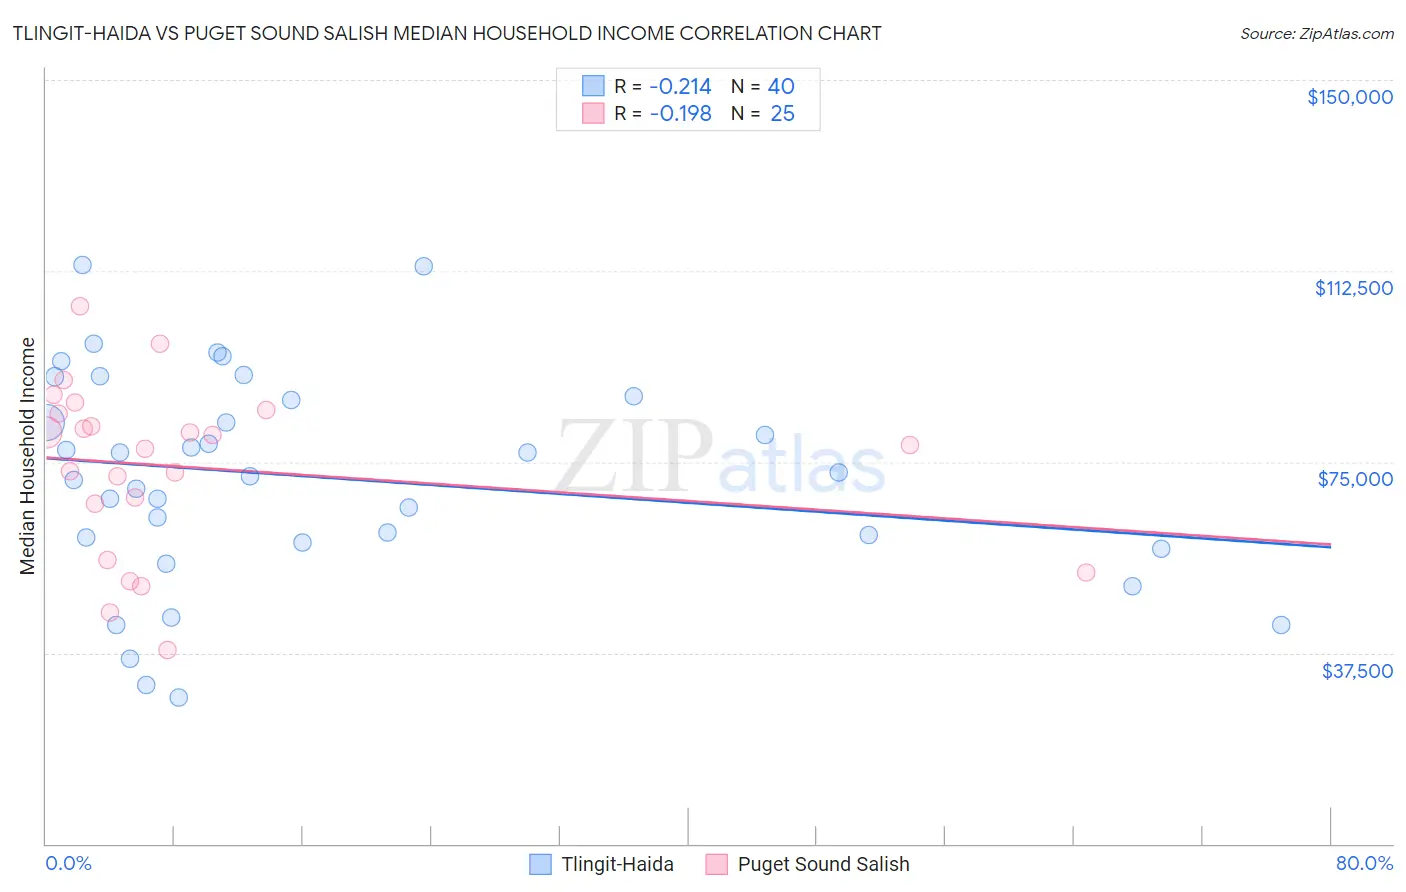
Tlingit-Haida vs Puget Sound Salish Median Household Income Correlation Chart
The statistical analysis conducted on geographies consisting of 60,854,436 people shows a weak negative correlation between the proportion of Tlingit-Haida and median household income in the United States with a correlation coefficient (R) of -0.214 and weighted average of $83,968. Similarly, the statistical analysis conducted on geographies consisting of 46,152,941 people shows a poor negative correlation between the proportion of Puget Sound Salish and median household income in the United States with a correlation coefficient (R) of -0.198 and weighted average of $84,011, a difference of 0.050%.
Median Household Income Correlation Summary
| Measurement | Tlingit-Haida | Puget Sound Salish |
| Minimum | $28,750 | $37,964 |
| Maximum | $113,574 | $105,684 |
| Range | $84,824 | $67,720 |
| Mean | $71,962 | $73,927 |
| Median | $72,542 | $78,333 |
| Interquartile 25% (IQ1) | $59,644 | $61,302 |
| Interquartile 75% (IQ3) | $87,562 | $84,790 |
| Interquartile Range (IQR) | $27,918 | $23,488 |
| Standard Deviation (Sample) | $20,793 | $16,803 |
| Standard Deviation (Population) | $20,531 | $16,464 |
Demographics Similar to Tlingit-Haida and Puget Sound Salish by Median Household Income
In terms of median household income, the demographic groups most similar to Tlingit-Haida are Belgian ($84,008, a difference of 0.050%), Immigrants from Colombia ($83,902, a difference of 0.080%), Kenyan ($84,085, a difference of 0.14%), Slovak ($83,798, a difference of 0.20%), and Iraqi ($83,753, a difference of 0.26%). Similarly, the demographic groups most similar to Puget Sound Salish are Belgian ($84,008, a difference of 0.0%), Kenyan ($84,085, a difference of 0.090%), Immigrants from Colombia ($83,902, a difference of 0.13%), Slovak ($83,798, a difference of 0.25%), and Iraqi ($83,753, a difference of 0.31%).
| Demographics | Rating | Rank | Median Household Income |
| Immigrants | Eritrea | 48.8 /100 | #177 | Average $85,025 |
| Czechoslovakians | 47.8 /100 | #178 | Average $84,965 |
| English | 47.0 /100 | #179 | Average $84,915 |
| Immigrants | Portugal | 44.2 /100 | #180 | Average $84,740 |
| Hawaiians | 44.1 /100 | #181 | Average $84,729 |
| Uruguayans | 43.5 /100 | #182 | Average $84,691 |
| Spaniards | 42.7 /100 | #183 | Average $84,644 |
| Immigrants | Eastern Africa | 37.4 /100 | #184 | Fair $84,299 |
| Kenyans | 34.2 /100 | #185 | Fair $84,085 |
| Puget Sound Salish | 33.2 /100 | #186 | Fair $84,011 |
| Belgians | 33.2 /100 | #187 | Fair $84,008 |
| Tlingit-Haida | 32.6 /100 | #188 | Fair $83,968 |
| Immigrants | Colombia | 31.7 /100 | #189 | Fair $83,902 |
| Slovaks | 30.2 /100 | #190 | Fair $83,798 |
| Iraqis | 29.6 /100 | #191 | Fair $83,753 |
| Welsh | 28.0 /100 | #192 | Fair $83,628 |
| Finns | 27.7 /100 | #193 | Fair $83,607 |
| Ghanaians | 27.4 /100 | #194 | Fair $83,582 |
| Immigrants | Armenia | 27.0 /100 | #195 | Fair $83,555 |
| French | 26.0 /100 | #196 | Fair $83,468 |
| Aleuts | 25.7 /100 | #197 | Fair $83,446 |